Data QA before Algo Trading backtesting: why your dataset can mislead you
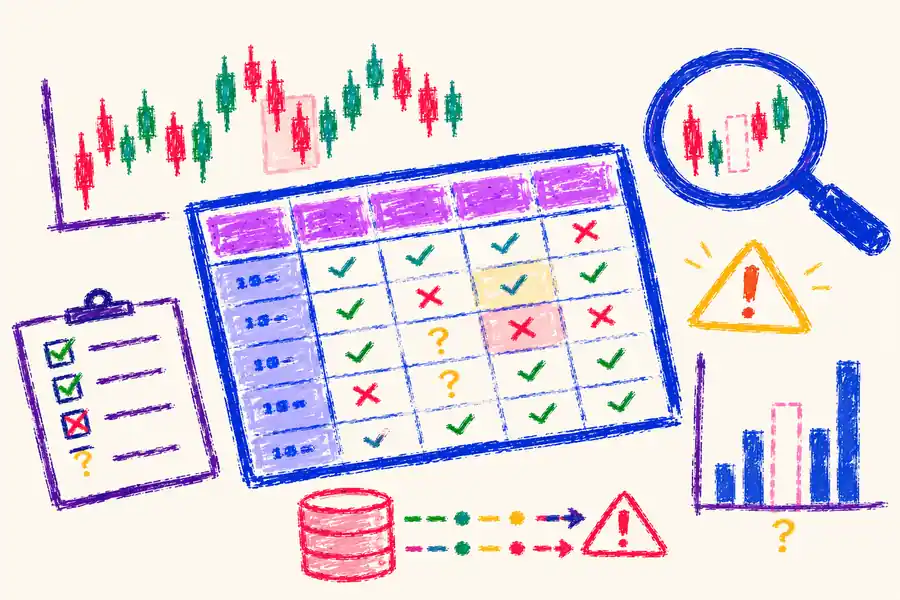
A backtest can be wrong even when the file opens, the candles look plausible and the code runs without an exception. Current-only constituents, unavailable-at-the-time fields, duplicate rows, missing sessions, unlabelled adjustments and unstable identifiers can all change the result. Before trusting a strategy, define the dataset you need, test it against that contract and stop when a material defect cannot be explained.
Define “fit for this question” before inspecting the file
“Clean data” is not a universal property. A table can be suitable for a descriptive chart and unsuitable for an investable historical backtest. Write the research contract first:
| Contract field | Question to answer |
| Research question | What will this calculation or backtest estimate? |
| Universe | Which securities were eligible on each date? |
| Period and warm-up | What are the start, end and look-back dates? |
| Frequency and timestamp | Is each row daily, intraday, bar-start, bar-end or publication time? |
| Session and timezone | Which market states and calendar are included? |
| Identity | Which stable key survives symbol changes? |
| Price basis | Are prices raw, vendor-adjusted or locally adjusted? |
| Missingness | What happens to gaps, suspensions and no-trade intervals? |
| Provenance | Which source, version, retrieval time and usage terms apply? |
If you cannot fill these fields, the status is “not yet specified”, not “probably fine”.
Test the historical universe before testing the strategy
Current constituents are not automatically historical constituents
Nifty Indices publishes a reconstitution schedule for broad indices and notes that additional reviews can follow arrangements, suspensions or delistings. (1) If you download today’s list and apply it to old prices, you may have removed securities that were eligible at the historical date or included names that were not yet eligible.
Ask a precise question: was the universe meant to represent what an investor could have known and traded on each date, or only the companies that survive today? A current-only study can answer the latter descriptive question when labelled that way; it cannot automatically answer the historical-investability question.
Survivorship is not limited to bankrupt companies. A security can leave after a merger, suspension, symbol change, index removal, eligibility failure or graduation to another segment. A removal can reflect success and still matter to the historical sample. The general performance-study literature documents how omitting observations that disappear can make a sample look better than the full historical population. (9)
Worked synthetic example: the universe changes the arithmetic
The following fixture is deliberately synthetic and non-Indian. It is not Nifty data, NSE data, a survivorship estimate or a strategy return.
| Date | A | B | C | Intended members |
| 1 January 2026 | 100 | 100 | 100 | A, B, C |
| 2 January 2026 | 102 | 101 | 40 | A, B, C |
| 3 January 2026 | 101 | 100 | — | A, B; C leaves this illustrative universe |
From 1 to 2 January, the current-survivor-only mean is:
(+2% + +1%) / 2 = +1.5%The historical A/B/C mean is:
(+2% + +1% − 60%) / 3 = −19.0%The exaggerated loss makes the construction problem visible: removing one historical member changes a descriptive mean. It does not tell us how a real portfolio would handle a delisting, and it is not an Indian market measurement. A real study needs a time-stamped membership record and a declared rule for exits.
For Indian security identity, NSE’s trading-availability page provides separate files for equity, T+0 securities, symbol changes and company-name changes. (2) Those are useful inputs for a security master, but they are not automatically a complete point-in-time constituent history.
Check information availability, not only the timezone
Keep three timestamps separate when they matter:
- Observation time: when the trade, bar or market state occurred.
- Availability time: when the file, API field or corporate-action record became available to the researcher.
- Decision time: when the strategy could have made its decision.
For a feature (F) used at decision time (D), the local ordering check is:
FEATURE_AVAILABLE_TIMESTAMP <= DECISION_TIMESTAMPWorked synthetic availability check
Both rows below use a decision time of 09:20 IST. The values are synthetic and do not claim a provider’s publication delay.
| Instrument | Decision time | Feature available | Available by decision? | Status |
| A | 09:20 | 09:15 | Yes | Pass this local check |
| B | 09:20 | 09:25 | No | Block until corrected |
The second row cannot be used at 09:20. This is a data-construction failure, not a complete strategy-level look-ahead analysis. The broader bias interpretation belongs in Topic 11.
Session labels matter too. NSE lists the normal/odd-lot cash-market window as 09:15–15:30 and documents closing-auction and post-close states separately. (3), (4) A 15:30 continuous-market close, an auction value and a post-close observation are not interchangeable rows. Put the session state and timestamp meaning in the dataset contract.
Test identity, duplicate keys and joins
Symbols are convenient labels, not permanent identities. Retain a stable identifier where the source provides one, the symbol history and the version of the security master used for the run.
Declare the key before deduplicating:
EOD:       (INSTRUMENT_KEY, SESSION_DATE)
INTRADAY:  (INSTRUMENT_KEY, SESSION_DATE, BAR_START)
Classify duplicates rather than deleting them:
- exact duplicates with identical values;
- conflicting values for the same key;
- corrections with a later source timestamp;
- collisions between regular and auction-session rows;
- identity errors caused by symbol-only matching.
For a duplicate key, preserve the source rows and quarantine a conflict. “Last row wins” is not a policy unless the source documents why.
When joining an indicator table to prices, validate the expected relationship. The pandas candle guide covers the mechanics; the QA question is whether the resulting rows still represent the intended observations.
joined = prices.merge(
    indicators,
    on=["instrument_key", "session_date"],
    how="left",
    validate="one_to_one",
    indicator=True,
)
If the right table contains two rows for one key, a one-to-one merge should fail rather than double a price row. Inspect row counts before and after the merge, and review left_only, right_only and both when coverage matters. Pandas’ null-key matching also differs from ordinary SQL joins, so null keys need a separate check. (5)
Test prices, volume and corporate-action labels
Run simple invariants on every non-null OHLCV row:
HIGH >= MAX(OPEN, CLOSE, LOW)
LOW  <= MIN(OPEN, CLOSE, HIGH)
HIGH >= LOW
VOLUME >= 0 WHEN VOLUME IS A QUANTITY
These checks catch malformed rows and some parser or unit errors. They do not prove that a valid-looking close is the correct close or that volume is comparable across instruments.
Raw and adjusted prices answer different questions
NSE’s corporate-action guidance describes adjustments intended to preserve the relative position of market participants across cum and ex dates. (6) Nifty methodology also documents index maintenance for splits, stock dividends, share changes and arrangements. (7)
An adjusted series may be useful for a continuity or return calculation. Raw traded prices may be necessary when reconstructing the quote or execution seen by a strategy. Keep raw and adjusted fields separate and record:
- action type and effective/ex-date;
- adjustment factor or named source method;
- source reference;
- price basis (
raw,vendor_adjustedorlocally_adjusted); - review status.
If an old close is 100 and the next close is 50, do not immediately call it a 50% economic loss. It could be a split-like event, a parser error, a symbol change or a genuine move. Without an action record and factor, mark it pending_review.
Test missing sessions and missing bars
A missing observation can represent a holiday, suspension, no-trade interval, partial session, provider gap or parser failure. Compare expected timestamps with the relevant exchange calendar and security status before deciding what it means.
Do not automatically insert zero prices, forward-fill every close, convert absent volume to zero, delete a security after its last row or count a missing session as a flat return. A regular-continuous five-minute contract may expect 09:15, 09:20 and so on through the stated close; it should not treat an auction row as a missing continuous bar. (3), (4)
The synthetic audit below expects dates 1–4 January and observes 1, 2 and 4 January, so it flags 3 January as missing. That is not a claim that 3 January was an NSE holiday. In a real run, reconcile the date with the official calendar, suspension state and source coverage.
Keep provenance with the rows
A dataset without provenance is difficult to reproduce and harder to challenge. Record at least:
RUN_ID
SOURCE PUBLISHER AND FILE/ENDPOINT
RETRIEVAL TIME AND SOURCE PERIOD
SCHEMA OR FORMAT VERSION
RAW FILE HASH
UNIVERSE AND CALENDAR RULE
TIMESTAMP SEMANTICS AND TIMEZONE
PRICE BASIS AND ADJUSTMENT POLICY
INPUT, OUTPUT AND QUARANTINE ROW COUNTS
DUPLICATE, GAP AND INVARIANT RESULTS
AUTHORISED-USE OR LICENCE NOTE
NSE’s Data Sharing & Usage Policy says that use, sharing, display and redistribution are governed by relevant agreements; its Terms of Use also restrict systematic collection and copying or redistribution without permission, subject to the stated download terms. (8) Treat provenance as a compliance control as well as an engineering field. Where to Get NSE/BankNifty Data at Every Price Tier compares source choices, while Building a Clean NSE Data Pipeline owns raw-file and parser controls.
Classify the audit: pass, investigate or block
Use an action-oriented status rather than one attractive “data-quality score”:
| Status | Meaning | Action |
| Pass | The check passed under the stated contract | Continue and retain the evidence |
| Investigate | The observation may be valid but needs calendar, source or action context | Do not treat the dataset as final yet |
| Block | The defect conflicts with the contract or cannot be explained | Stop the backtest and preserve/quarantine the evidence |
A compact report could look like this:
| Check | Result | Status | Action |
| Historical membership | Current-only list differs from intended historical rule | Block or re-scope | Obtain point-in-time membership or change the question |
| Availability timestamp | One feature arrives after the decision | Block | Remove or correctly timestamp the feature |
| Duplicate key | One conflicting duplicate | Block | Preserve both rows and resolve the source state |
| Expected date | One date absent | Investigate | Reconcile calendar, suspension and source coverage |
| OHLC relationship | high < open in one row | Block | Review the raw record and parser |
| Corporate-action factor | Missing | Investigate | Keep raw values and obtain the action record |
The synthetic +1.5% and −19.0% figures above are the only numerical universe illustration here. They are explicitly non-Indian and do not measure survivorship in any NSE or Nifty dataset.
What this audit cannot prove
Passing these checks removes specified data defects; it does not prove that a strategy has no look-ahead or overfitting, that an engine models fills correctly, that transaction costs are realistic, that historical relationships persist, or that the source is licensed for every intended use. The strategy-level interpretation belongs in Why Backtests Lie: Look-Ahead and Survivorship Bias. Backtesting 101: Vectorized vs Event-Driven is the next architecture decision after the input contract passes.
No real point-in-time constituent history, complete delisted-security archive or target-period corporate-action dataset was used for this article. Any future DailyBulls India-specific number must be calculated from a permitted, documented dataset with a reproducible universe rule.
The synthetic checks were rerun on 6 August 2026 on Linux x86_64 with Python 3.12.13, pandas 3.0.5 and NumPy 2.3.5. The recorded fixture produced the same canonical output hash as the research pack. This confirms the example’s reproducibility; it is not a Windows compatibility test or evidence about real NSE data.
Sources
(1) NSE Indices, “Index Reconstitution Calendar”: https://www.niftyindices.com/resources/index-rebalancing-schedule
(2) NSE India, “Securities available for Trading”: https://www.nseindia.com/static/market-data/securities-available-for-trading
(3) NSE India, “Market Timings”: https://www.nseindia.com/static/market-data/market-timings
(4) NSE India, “Closing Auction Session”: https://www.nseindia.com/static/products-services/closing-auction-session
(5) pandas, “DataFrame.merge” and “Merge, join, concatenate and compare”: https://pandas.pydata.org/docs/reference/api/pandas.DataFrame.merge.html; https://pandas.pydata.org/docs/user_guide/merging.html
(6) NSE India, “Adjustments in case of Corporate Actions”: https://www.nseindia.com/static/products-services/equity-derivatives-corporate-actions-adjustments
(7) NSE Indices, “Methodology Document for Equity Indices”: https://www.niftyindices.com/Methodology/Method_NIFTY_Equity_Indices.pdf
(8) NSE/NSE Data & Analytics, “NSE Data Sharing & Usage Policy” and “Terms of Use”: https://www.nseindia.com/static/market-data/nse-data-policy; https://www.nseindia.com/static/nse-terms-of-use
(9) Stephen J. Brown, William Goetzmann, Roger G. Ibbotson and Stephen A. Ross, “Survivorship Bias in Performance Studies”: https://terpconnect.umd.edu/~wermers/ftpsite/FAME/Brown_Goetzmann_Ibbotson_Ross.pdf
Share this insight
Spread the Alpha
Related Articles
More ideas that align with your trading playbook.
pandas for Algo Trading Data: A Practical Crash Course for Candle Data
Pandas becomes useful for trading research when you make time, price fields and table grain explicit. Sort each instrument’s timestamps, define the…
Building a Clean NSE Data Pipeline for Algo Trading: From Bhavcopy to Research-Ready Candles
Building a clean NSE data pipeline means more than download a file. It preserves the original input, records where each row came…
Where to Get NSE/BankNifty Data for Algo Trading at Every Price Tier
There is no single best NSE data source for every backtest. Public NSE reports suit low-cost EOD work; community tools help exploration…
 DailyBulls (Arthashilpi Ventures) is a D-U-N-S verified company.