STT Hike Fears Hit Capital-Market Stocks After NSE Warning
NSE commentary on April STT impact immediately resets turnover expectations
Comments on February 27, 2026 linked the April 1, 2026 securities transaction tax change to a likely decline in derivatives activity. This signal quickly moved into prices of market-intermediation stocks.
The sharpest reaction was in stocks linked to exchange activity, broking flows, and transaction-based service revenue, with intraday declines of about 4% in parts of the group.
The transmission was direct. If futures and options turnover slows after the tax increase, revenue pools tied to frequent trading can compress faster than the broader financial sector. The move reflected real-time repricing of a policy channel rather than a broad risk-off shift.
Selling concentrates where revenue depends on market activity, not balance-sheet lending
The sell-off was concentrated in business models with high sensitivity to market participation. Exchanges, brokers, and depository-linked names came under pressure because earnings in these businesses depend on activity intensity, order flow, and transaction throughput.
Large lending institutions operate on a different earnings engine led by loan growth, spreads, and asset quality. This explains the uneven session inside financials: one segment is exposed to turnover economics, while another is anchored to balance-sheet performance.
Financials split in real time as intermediary risk reprices while large lenders hold stronger structure
The core reading is a split inside financials. The market appears to be pricing transaction-fee risk more aggressively than core lending risk, so repricing has been faster in market-intermediation names than in large banks with diversified credit books.
A valid counter-view is that this may still be a temporary sentiment move within a wider macro de-risking phase, where early resilience in lenders may weaken if broader index pressure deepens.
This divergence view would weaken if turnover-linked names recover and sustain relative outperformance without any easing in the STT and participation-tightening narrative, or if major lenders lose current trend support and move into a broader financial downtrend.
Trend comparison grid shows policy-sensitive weakness versus lender resilience inside the same financial basket
Technical snapshot as of the close on February 26, 2026:
| Ticker | Last price | Day change (%) | Traded volume | Average volume | RSI (14) | MACD line | MACD signal | SMA 20 | SMA 50 | Trend versus moving averages |
|---|---|---|---|---|---|---|---|---|---|---|
| SBIN | 1209.50 | 0.83 | 15,987,699 | 14,408,573 | 68.00 | 46.5946 | 47.0778 | 1155.48 | 1069.34 | Above both SMA 20 and SMA 50 |
| ICICIBANK | 1404.90 | 0.36 | 27,073,133 | 13,043,945 | 53.52 | 4.5468 | 5.6853 | 1397.03 | 1384.49 | Above both SMA 20 and SMA 50 |
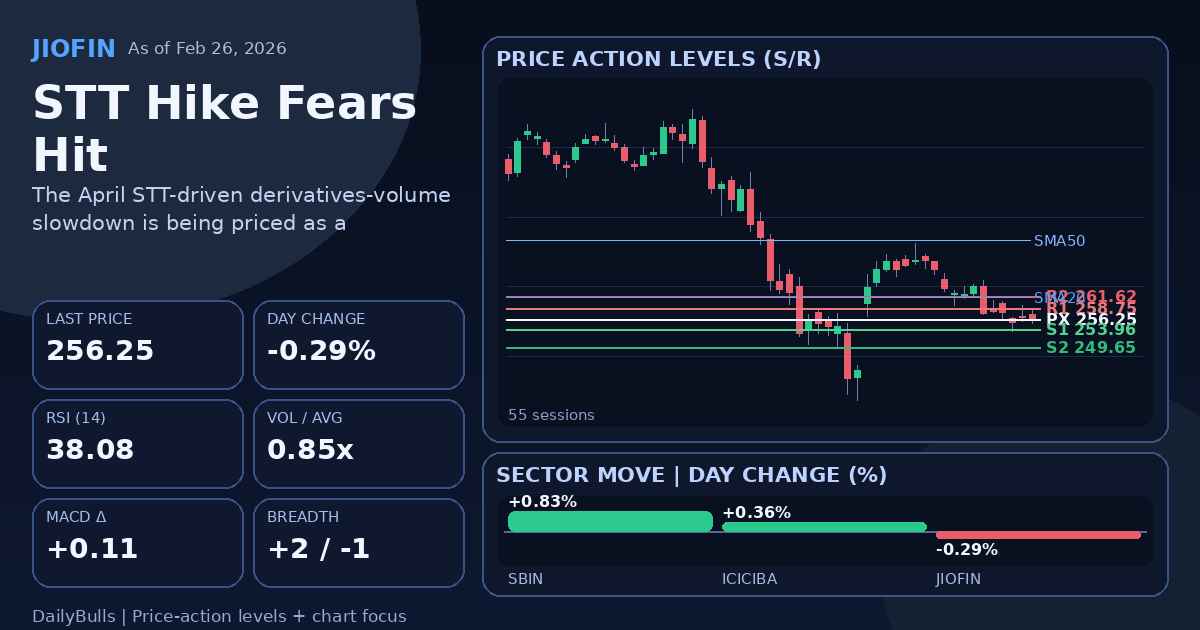
| JIOFIN | 256.25 | -0.29 | 8,562,168 | 10,021,766 | 38.08 | -4.4511 | -4.5637 | 261.42 | 274.90 | Below both SMA 20 and SMA 50 |
The comparison shows both banks above short- and medium-term moving averages, while JIOFIN remains below both. Momentum is also split, with JIOFIN showing lower RSI and weaker MACD positioning versus the two lenders. This supports a divergence inside financials rather than a uniform technical breakdown.
Evidence remains event-day heavy and cannot yet separate repricing from transient sentiment
The evidence is clear on trigger but limited in time depth. The narrative is based mainly on same-day price action tied to policy commentary, with prior policy context reinforcing a tightening direction.
This is enough to explain the session, but not enough to establish persistence. The move may still reflect short-horizon sentiment and positioning rather than a durable re-rating.
Current read is a policy-tightening narrative with selective financial stress, not sector-wide collapse
The most defensible reading is selective stress within financials, driven by repricing of turnover-linked earnings risk under a tighter derivatives regime. The action does not yet indicate a uniform break across the full financial complex.
The trigger was policy-linked, the transmission path was business-model specific, and the observed split between intermediaries and large lenders fits that channel. At the same time, the evidence window remains short, so this is an event-day interpretation with clear limits rather than a settled multi-week conclusion.
Share this insight
Spread the Alpha
Related Articles
More ideas that align with your trading playbook.

SEBI’s Commodity Plan Just Lost Its Institutional Anchor. What It Means for MCX
SEBI wanted banks, insurers, and eventually pension funds to deepen India's commodity derivatives market. RBI and IRDAI are not inclined to allow…

India’s Data Center Power Trade: Which Stocks Benefit First if AI Infra Spending Accelerates?
India's AI buildout may look like a software story, but the first listed winners could emerge from transformers, cables, switchgear, backup power,…

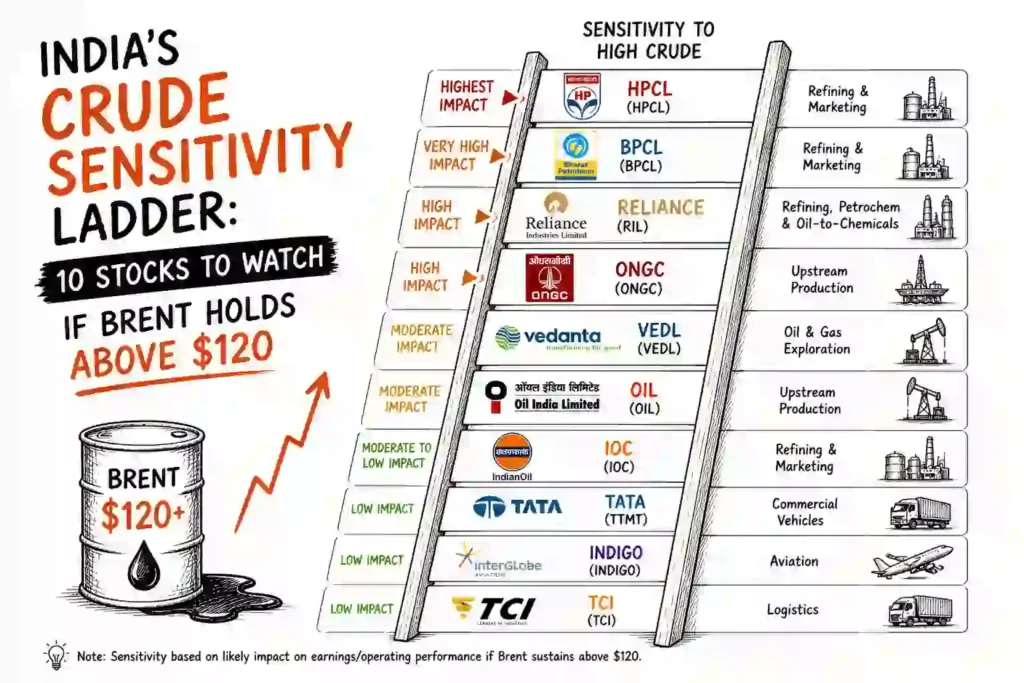
If Brent Holds Above $120 for 2 Weeks, Which Indian Sectors Reprice First?
A one-day crude spike can be ignored. Two weeks above $120 Brent is different. At that point, Indian markets stop treating oil…
 DailyBulls (Arthashilpi Ventures) is a D-U-N-S verified company.