Sector Heatmap: IT Leads, AUTO Trails
Session Snapshot
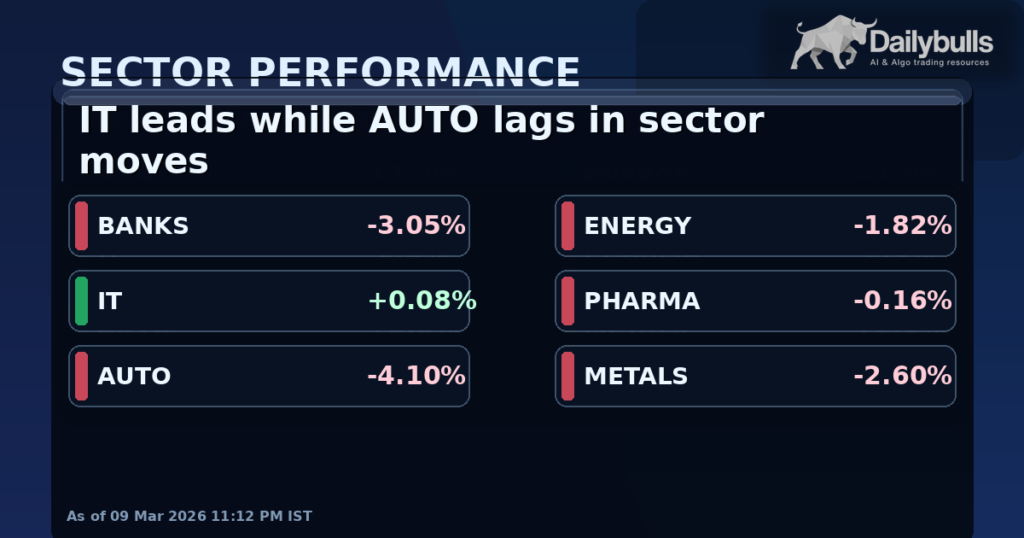
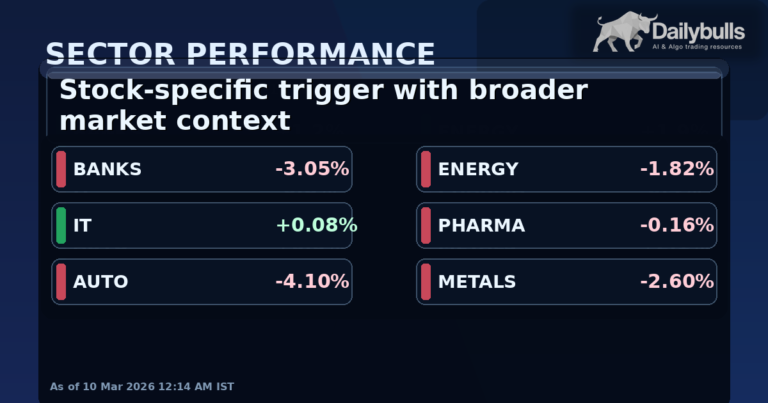
Indian sector indices closed with mixed and differentiated performance. The strongest one-day move came from IT (+0.08%), while AUTO (-4.10%) was the weakest among tracked sectors.
This spread highlights active internal rotation rather than a uniform market move.
Why Dispersion Matters
Sector dispersion helps show where risk is being added and where it is being reduced. When leadership rotates quickly across defensives, cyclicals, and rate-sensitive groups, index action can stay choppy even if the benchmark headline appears straightforward.
Internals often carry more signal than the headline print during transition phases.
Rolling Trend Context
On a 5-session basis, the strongest relative trend is in PHARMA (-0.08%), while AUTO (-7.79%) is weakest.
Over roughly 1 month, leadership is with PHARMA (+4.43%), and the laggard is IT (-15.30%).
Volatility Split
Recent realized volatility is highest in METALS at about 32.92% (10-session annualized estimate), while PHARMA is relatively calmer near 17.15%.
This volatility gap helps explain why sentiment can feel unstable across sectors.
Range Positioning
- BANKS: 20-session band 56019.80 to 61550.80
- IT: 20-session band 30053.50 to 35722.20
- AUTO: 20-session band 25965.95 to 28693.40
- ENERGY: 20-session band 35589.60 to 37181.80
- PHARMA: 20-session band 22194.90 to 23301.65
- METALS: 20-session band 11688.80 to 12448.00
Comparing these bands with daily momentum helps distinguish breakout pressure from mean-reversion behavior.
Sector Table (1D)
| Sector | Change (1D) |
|---|---|
| IT | +0.08% |
| PHARMA | -0.16% |
| ENERGY | -1.82% |
| METALS | -2.60% |
| BANKS | -3.05% |
| AUTO | -4.10% |
Leadership Quality Check
A useful next filter is to compare daily winners with weekly and monthly trend leaders. When the same sector leads across timeframes, trend quality is generally stronger and follow-through probability improves. When daily leaders are different from weekly and monthly leaders, the session may reflect tactical repositioning instead of a durable shift in leadership.
In the current setup, leadership is not perfectly aligned across horizons, which supports a transition narrative rather than a settled one-way structure.
Practical Read-Through
For market structure analysis, the combination of breadth, volatility split, and range placement matters more than any single line item. Negative breadth with elevated volatility usually indicates selective de-risking, while mixed breadth with contained volatility can indicate internal reshuffling.
Range positioning then helps frame path dependency: sectors near top-end bands with weakening momentum can be prone to consolidation, while sectors near lower bands with improving momentum may attempt mean reversion. It also helps separate move quality: a strong one-day bounce near the bottom of a long range can behave very differently from a similar bounce near the top of an extended range. This framework keeps the interpretation data-led while avoiding overstatement.
Summary
This note combines daily moves, rolling trend persistence, and volatility/range context in a clean structure that is easy to scan and useful for session-to-session comparison without unnecessary noise. The goal is readability first, with enough depth to remain decision-relevant for active market monitoring.
Share this insight
Spread the Alpha
Related Articles
More ideas that align with your trading playbook.
Stock Focus: Stock Reaction: RELIANCE.NS +1.37% on Fresh Catalyst
Trigger The current market trigger centers on: Stock Reaction: RELIANCE.NS +1.37% on Fresh Catalyst. This development is being tracked as a stock…

Stock Focus: Stock Reaction: HDFCBANK.NS -1.91% on Fresh Catalyst
Trigger The current market trigger centers on: Stock Reaction: HDFCBANK.NS -1.91% on Fresh Catalyst. This development is being tracked as a stock…
Policy Watch: RBI injects Rs 50,000 crore durable liquidity in banking system via OMO purchases
Trigger The current market trigger centers on: RBI injects Rs 50,000 crore durable liquidity in banking system via OMO purchases. This development…