India Power T&D Execution Bottlenecks: Investor Playbook (2026)
Quick take
- The india power t&d execution bottlenecks story is simple: the capex runway is large, but returns depend on execution quality, not headline order announcements.
- In this cycle, the key chain is: award -> execution -> commissioning -> billing -> collection -> cash flow.
- The biggest bottlenecks are not always demand-side. They are often RoW/approvals, long-lead equipment, contractor bandwidth, and receivables.
- For investors, the practical edge is to track conversion quality and cash conversion, not just order book size.
Why this topic matters now
Power demand is rising, renewables need stronger grid links, and distribution networks still need upgrades. So yes, the T&D capex pipeline looks strong.
But this is where many investors get trapped. A project can be awarded, celebrated, and then delayed for quarters before earnings and cash flow show up.
So the right lens here is process, not headlines.
If you are new to this theme, start with the broader Make in India 2.0 capex playbook for cycle context, then read the capital goods order book quality framework to understand why execution quality and cash conversion matter before valuation rerating.
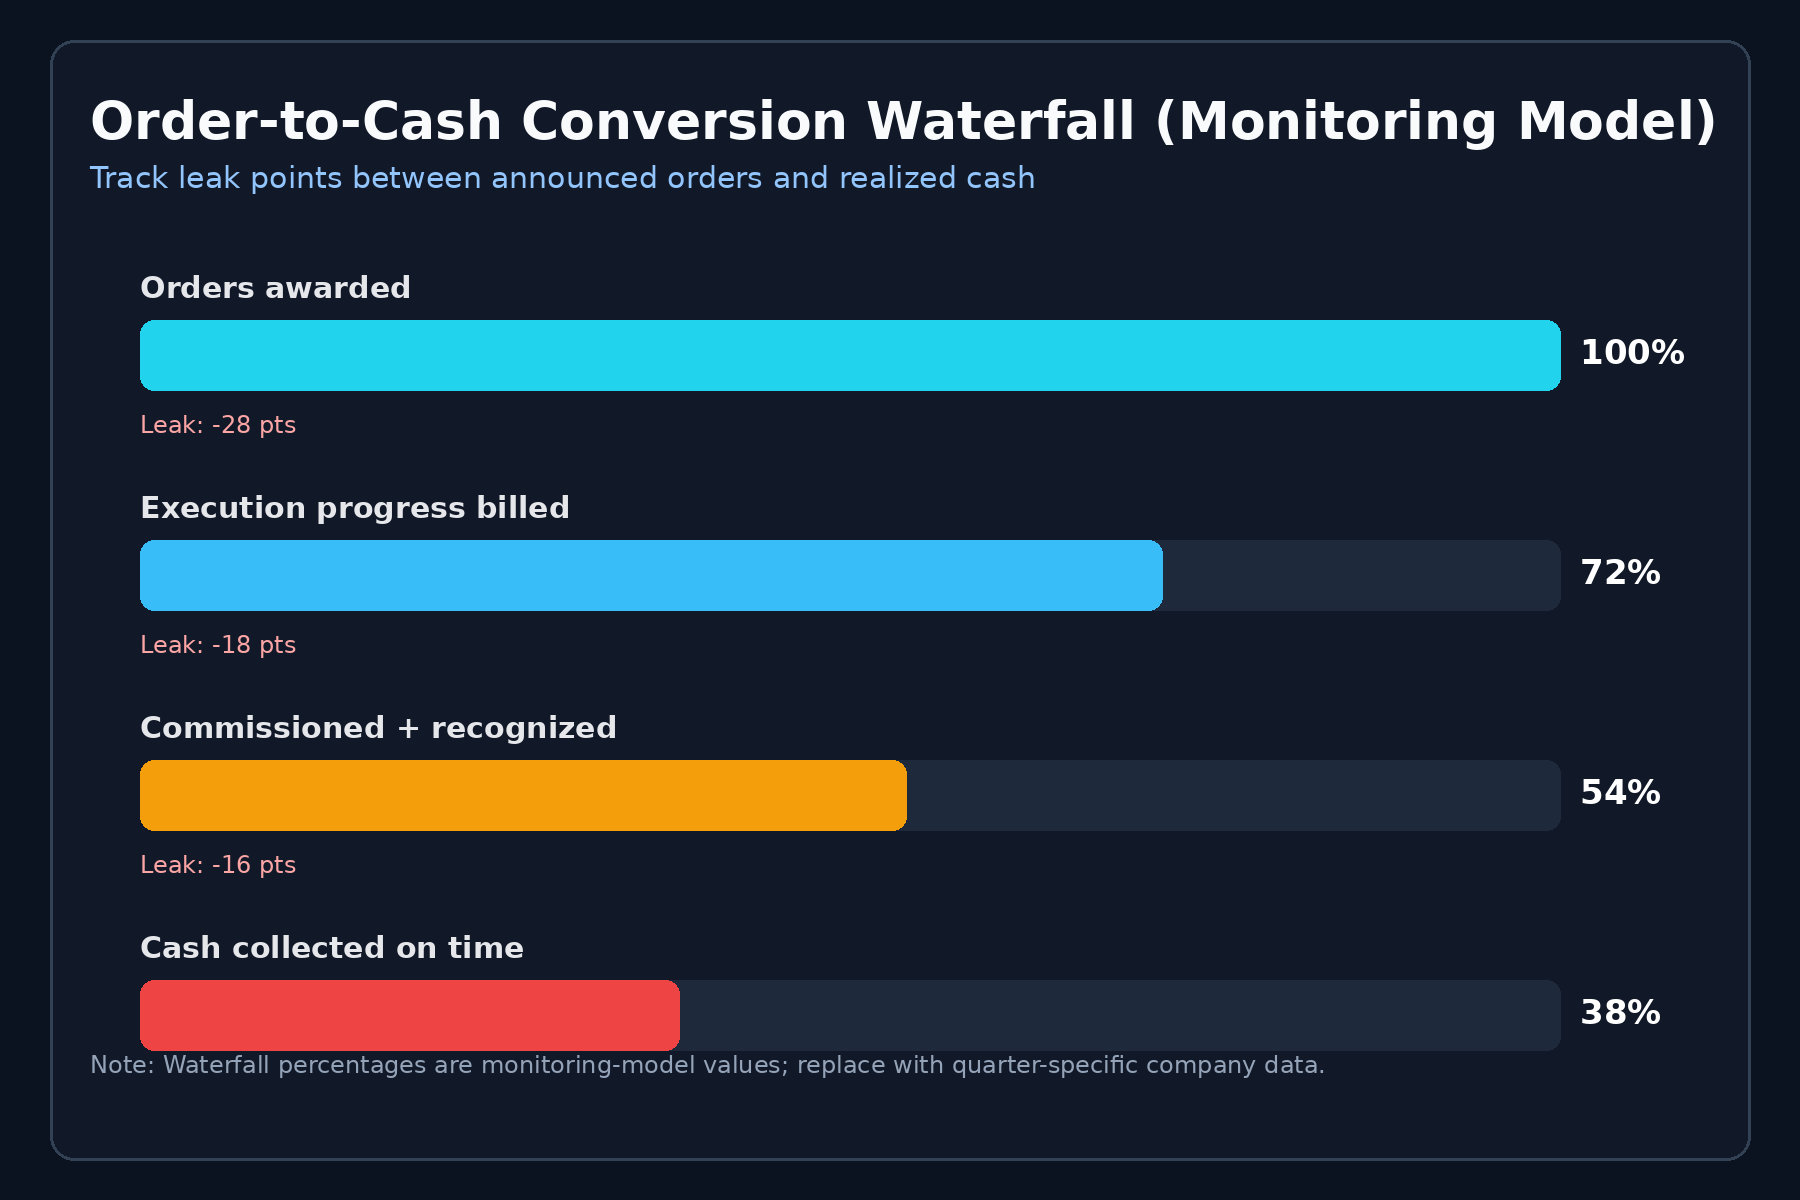
The capex-to-cash chain in power T&D
Do not compress this cycle into “order won = earnings done.” Every link below can delay profits or pressure margins:
- Tender and award
- Land/RoW and statutory clearances
- Engineering and procurement
- Equipment manufacturing and delivery
- Site execution and erection
- Testing and commissioning
- Billing and regulatory approval flow
- Collections and cash conversion
If links 2, 4, or 8 weaken, reported growth can look better than underlying quality.
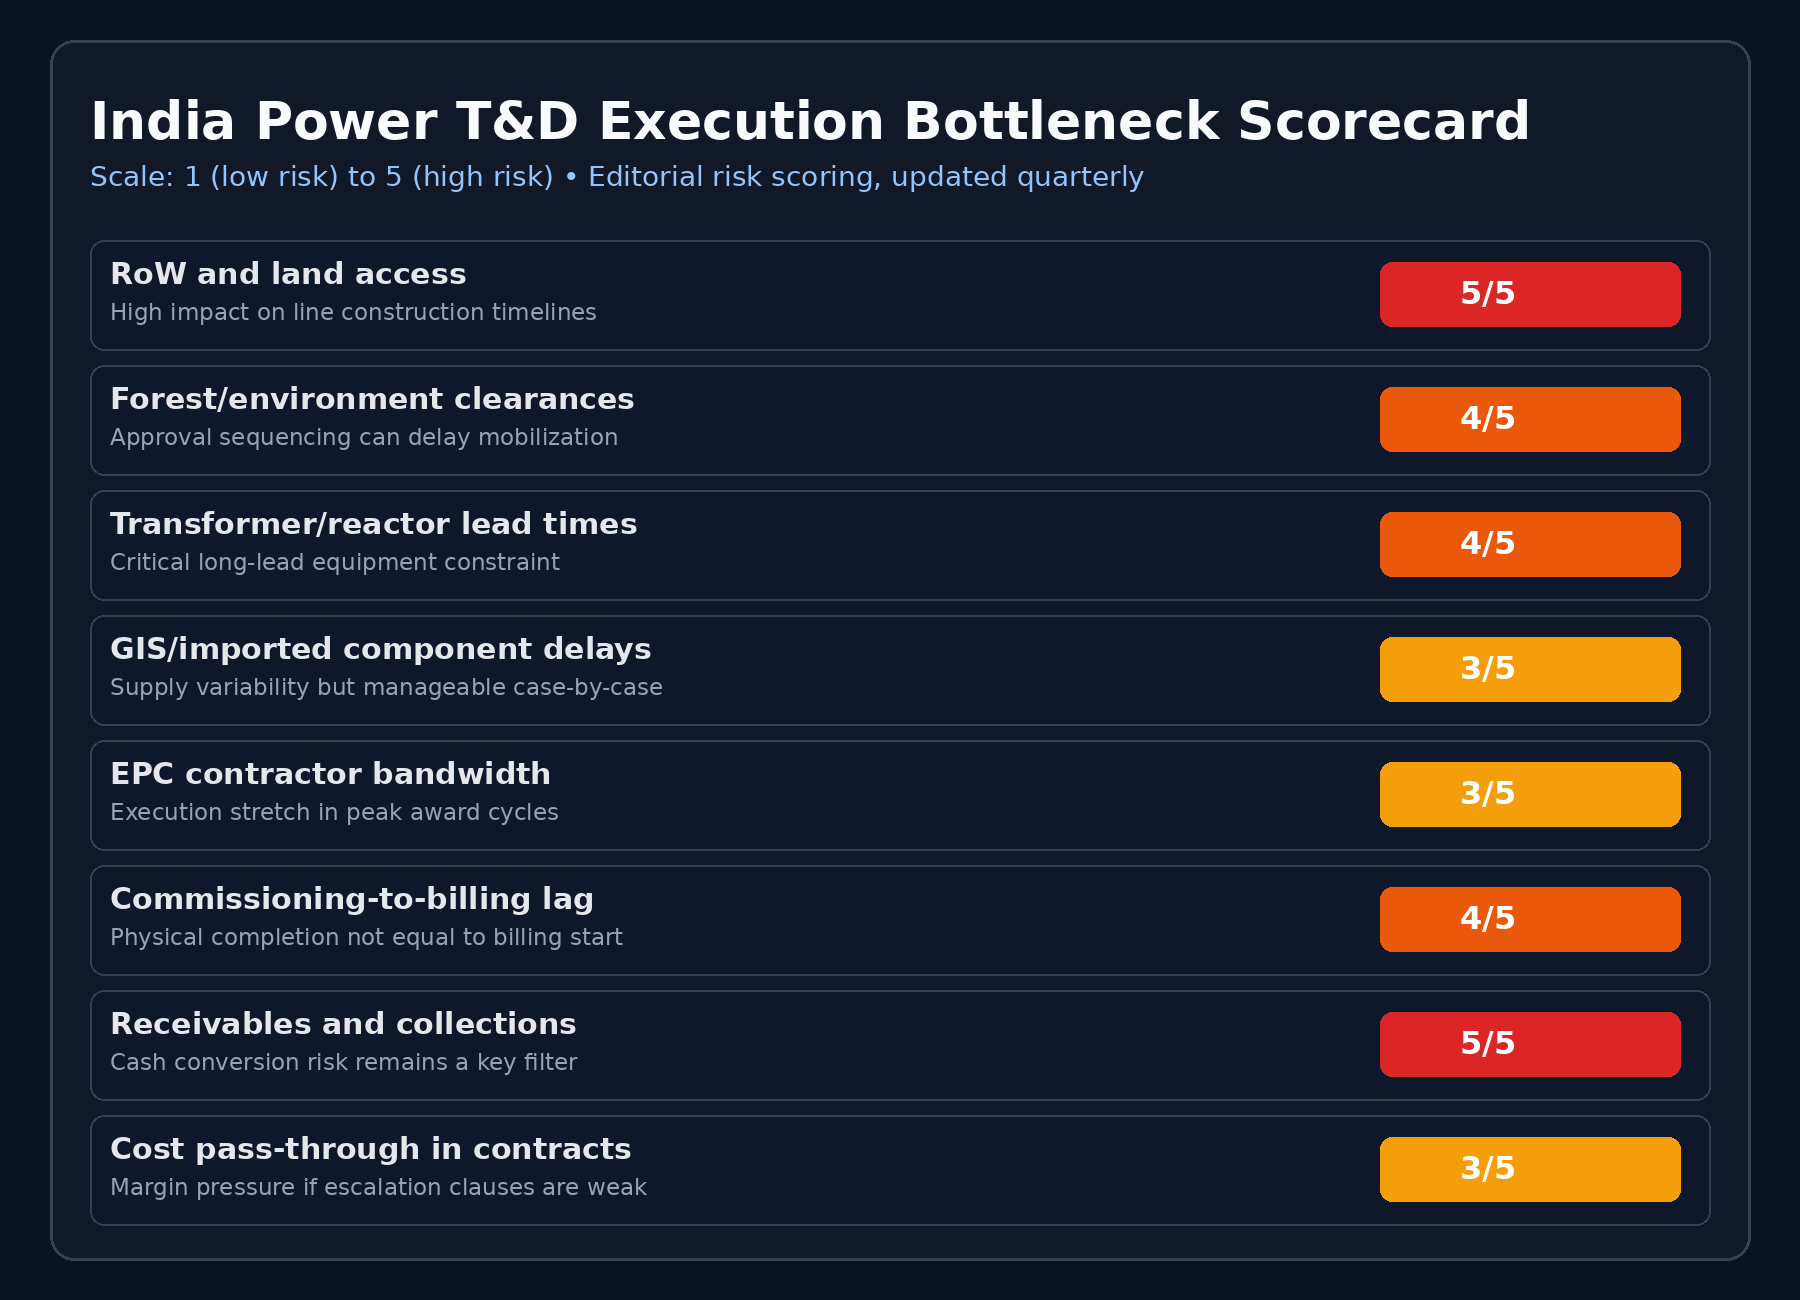
India power T&D execution bottlenecks: 12 things to track
A) Pre-construction bottlenecks
1) Right of Way (RoW) friction
Corridor access remains one of the most common causes of timeline slippage in large transmission projects.
2) Land and local access constraints
Substation and line-package progress can stall due to site-level issues even after order award.
3) Forest/environment clearance lag
Long-route and sensitive-area projects can face fragmented approvals that delay full mobilization.
4) Route revisions and alignment changes
Survey rework adds time and cost, especially in dense or contested zones.
B) Equipment and supply-chain bottlenecks
5) Transformer/reactor manufacturing lead times
These are long-lead critical items; slot availability can become the limiting factor in upcycles.
6) GIS and high-voltage component dependence
Imported or specialized components increase schedule risk if supply is tight.
7) Conductor/cable/insulator tightness
Even partial component bottlenecks can delay project closure.
C) Execution bottlenecks on ground
8) EPC contractor bandwidth stress
Simultaneous project load can stretch engineering, execution teams, and quality control.
9) Subcontractor quality variance
Weak subcontract execution often appears late and impacts commissioning quality.
10) Weather/terrain disruption
Monsoon and difficult topography can compress productive construction windows.
D) Commercial and cash-flow bottlenecks
11) Commissioning-to-billing lag
Physical completion does not always translate immediately into billing and revenue realization.
12) Collection delays and receivables stretch
Distribution-side payment discipline and procedural delays can weaken cash conversion despite reported earnings growth.
What to track each quarter (investor dashboard)
Use this as your quarterly scoreboard.
| Bucket | Metric | Why it matters |
|---|---|---|
| Order quality | Order inflow growth, executable mix (12-24 months) | Tests visibility vs noise |
| Execution velocity | Revenue conversion from backlog, on-time commissioning % | Shows whether orders are monetizing |
| Margin quality | EBITDA trend in execution business, input cost pass-through | Captures contract quality |
| Working capital | Receivable days, inventory days, net working capital days | Early warning for stress |
| Cash conversion | CFO/EBITDA, CFO/PAT | Separates accounting growth from real quality |
| Balance sheet | Net debt/EBITDA, contingent liabilities trend | Risk control in expansion phase |
Final score each quarter: Improving / Flat / Caution.
Winners vs traps: a practical framework
Potential winners usually show
- Consistent order inflow plus stable execution conversion
- Controlled receivable days during growth
- Margin discipline despite input volatility
- Specific, measurable management commentary (not broad optimism)
Potential traps usually show
- Large order book but repeated execution slippage
- Rising receivables with weak operating cash flow
- Margin volatility explained as “temporary” for multiple quarters
- Narrative strength without milestone-level delivery
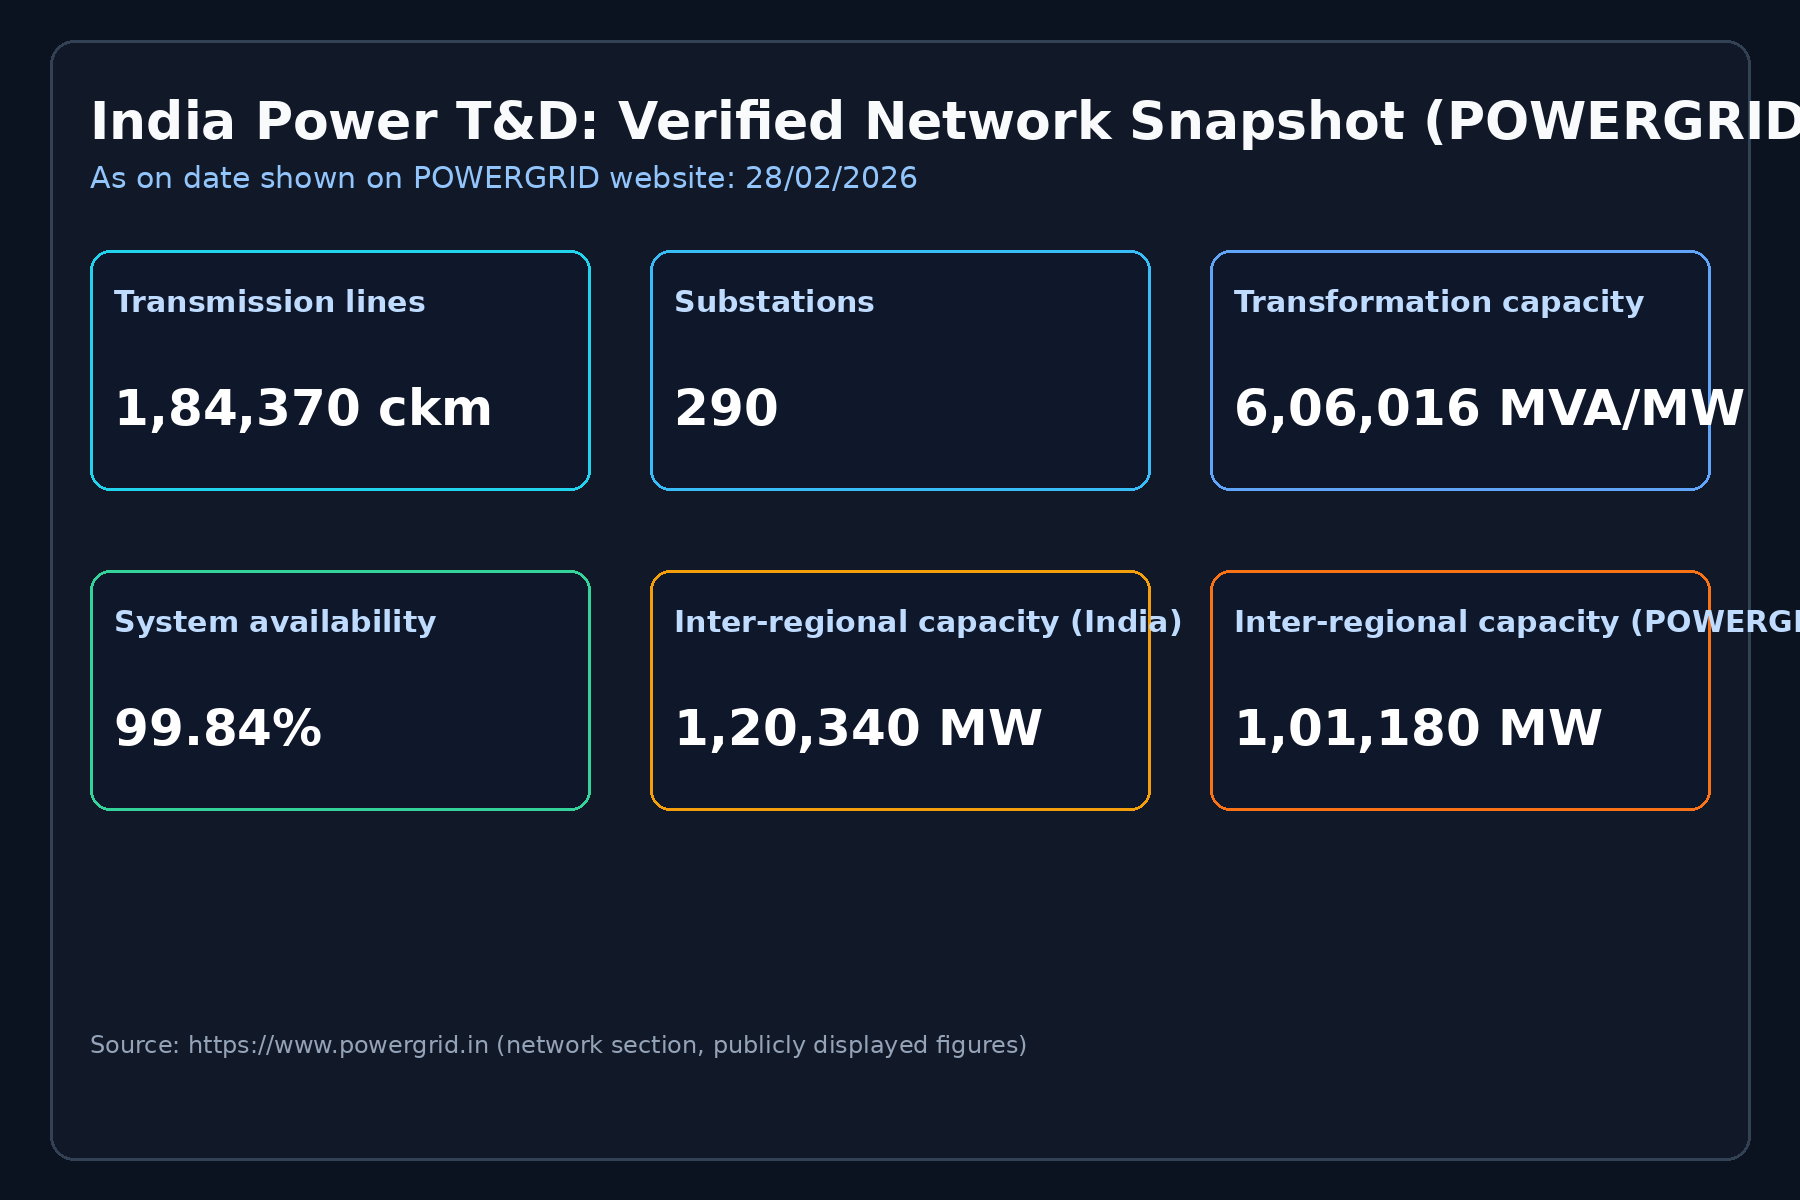
Segment lens: where bottlenecks bite hardest
Transmission projects
Most sensitive to RoW, clearances, and long-lead equipment cycles.
Distribution modernization
Most sensitive to utility-level execution quality, billing discipline, and payment cycles.
Equipment manufacturers
Most sensitive to capacity utilization, input costs, delivery commitments, and product mix.
Risk dashboard for this theme
- Approval and RoW delays extending project cycles
- Equipment lead-time inflation reducing commissioning pace
- Margin pressure in fixed-price contracts
- Receivables build-up and weaker CFO conversion
- Overvaluation ahead of delivery proof
- Policy-to-ground execution mismatch at state level
Valuation discipline in this cycle
In T&D themes, valuation often runs ahead of delivery. A simple reality check is to compare:
- Expected growth vs delivered commissioning
- Reported earnings vs operating cash flow
- Order announcements vs project milestone evidence
If delivery and cash do not confirm, narrative premium can unwind quickly.
Bottom line
India’s T&D build-out can be a strong multi-year opportunity under the broader Make in India 2.0 framework. But this is not a headline-to-profit theme. It is an execution-to-cash theme.
Use one filter, every quarter:
Order book quality + execution velocity + cash conversion quality
If all three hold, conviction can rise. If not, treat rallies as cyclical and size positions carefully. That is the core of the india power t&d execution bottlenecks framework.
FAQ
Is this a long-term story or a tactical trade?
Potentially long-term, but return paths are cyclical and execution-dependent.
What is the single most important metric?
Cash conversion quality (CFO vs EBITDA/PAT).
Why is order inflow alone not enough?
Because earnings quality depends on execution pace, margins, and collections.
Which segment should be tracked first?
Start with transmission execution quality and receivables discipline, then expand to distribution modernization and equipment cycles.
This content is for educational and market-tracking purposes, not investment advice.
Share this insight
Spread the Alpha
Related Articles
More ideas that align with your trading playbook.
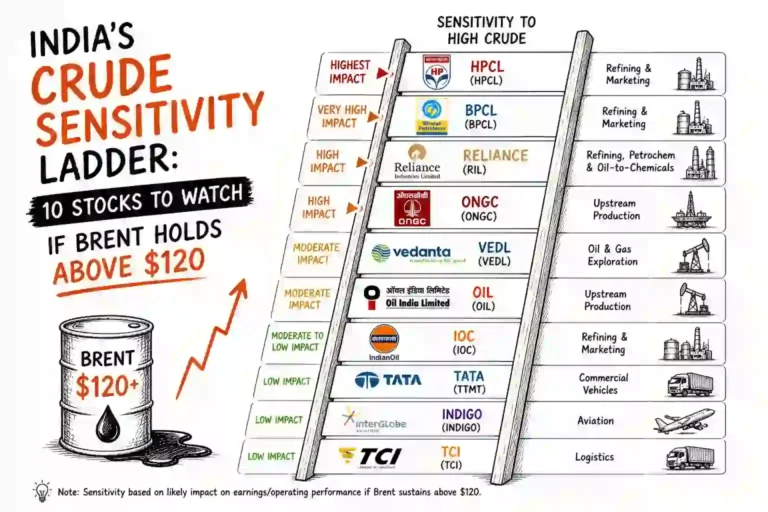
India’s Crude Sensitivity Ladder: 10 Stocks to Watch if Brent Holds Above $120
If Brent holds above $120, Indian equities are unlikely to react in one wave. This crude sensitivity ladder ranks 10 stocks to…
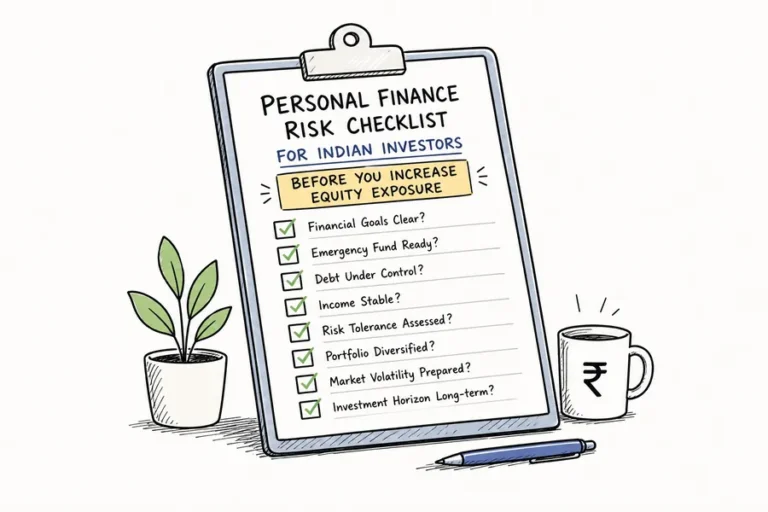
Personal Finance Risk Checklist for Indian Investors: Before You Increase Equity Exposure
The first risk in equity investing is not volatility. It is interruption. A strong portfolio needs time, cash-flow stability, and a household…
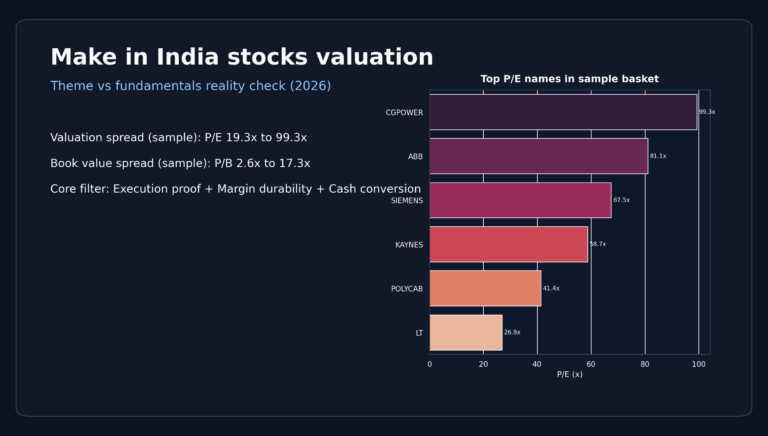
Make in India Stocks Valuation: Theme vs Fundamentals Reality Check (2026)
The Make in India manufacturing story is real. The valuation story is where things get tricky. In parts of the capex basket,…
 DailyBulls (Arthashilpi Ventures) is a D-U-N-S verified company.