Dailybulls

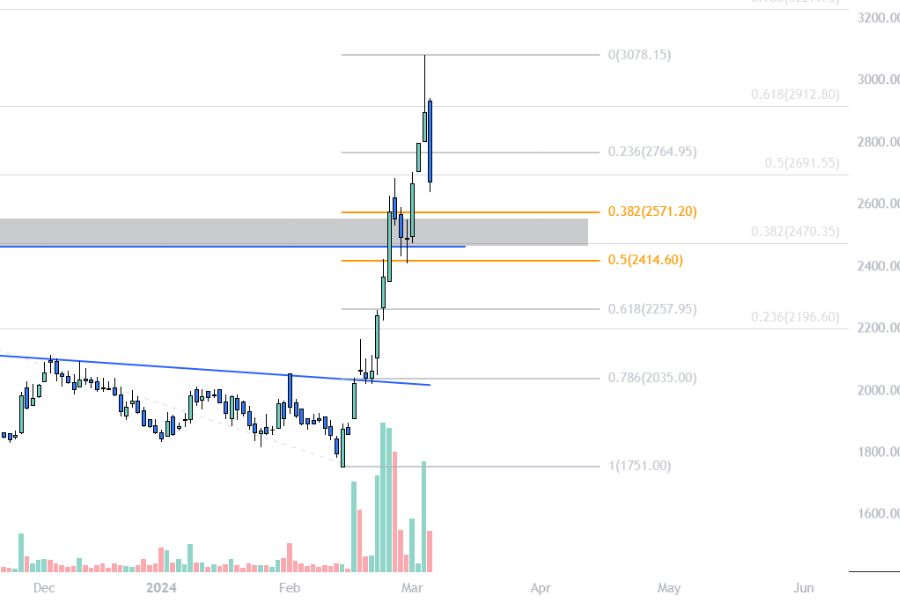
424% Return Defence stock now at Support – Government is Bullish!

Shares of Data Pattern (NSE: DATAPATTNS) have performed exceptionally well in the last 15 trading sessions, returning over 77% gains. After marking the low of ₹1751 in fourteenth of February, the stock rallied parabolically making an all time high of ₹3080.

The strong rally in defence stock was after the Indian government’s announcement to strengthen the tech used in defence. Data Patterns which work in Defence and Aerospace electronics can be seen benefiting from this strong momentum.

However, the stock fell by 7.75% on March 5, which might concern a lot of investors whether they should hold onto their profits or book their positions in Data Patterns. The stock have returned almost 424% since its listing, and government is highly bullish on the defence sector. 

What are the technicals of DATA PATTERNS telling?

Money Flow Index (MFI), which measures stocks momentum over a period of 14 days, is at 97.48. This shows that Data Pattern is overvalued and due for correction in price. With a Relative Strength signal of ‘Positive’, any correction may attract new buyers, rising DATAPATTNS stock price again.

Daily chart of Data Patterns compared to its volume data shows divergence in buy and sell volume. The stock rallied with increasing volume each time, but the sellers volume was muted, showing weak sellers.

While Nifty returned 7.2% in the last three months, Data Patterns outperformed the index by gaining over 30% in the same time period. It displays investors specific interest towards this defence stock compared to the overall market.

When Should you buy Data Patterns?

DATA PATTERNS TECHNICAL CHART

A good entry point in Data Patterns will be near 38.20% Fibonacci level (FIBO) which is around ₹2500. At this point, another strong bull rally can be anticipated as 38.20% fib level acts as a strong support in stocks with high momentum.

This is also the same area where the share broke from its short term resistance of ₹2600. This way, we can expect a reversal again from 2500 to 2600 levels. For swing trading refernce,  check DATAPATTNS weekly forecast.

Data Patterns Financials

Not just technicals, but financial data for Data Patterns was also quite strong last quarter. The company reported higher net profit of nearly 53% in the last quarter of 2023, compared to that of December 2022.

EBITDA margins also expanded for the company by nearly 39% making them the highest margins in the last ten years!

High PAT margins, Increasing sales growth, consistently high ROCE, all have contributed towards growth of Data Patterns in recent times.

DATAPATTNS Shareholders data

ShareholderPercentage
State or Government6.32%
Institutions15.2%
General Public22.8%
Individual Insiders55.7%

Data Pattern's Profit growth

PeriodProfit Growth
1 YEAR31.96%
3 YEAR80.61%
5 YEAR150.98%

Conclusion

Data Pattern presents another opportunity for swing traders as the stock declines. Long term investors should keep a bandwidth and trust on the company’s fundamentals and expected growth for investments.

Finding a fair price is not always possible, and it is alright to buy stocks at overvalued situations until their growth is intact.

With strong forecasted demand the stock can give an upside moment of about 30% in time to come. Long term investors can check Data Patterns share price target forecast up to 2030.

2.9/5 - (15 votes)

Disclaimer: Stock targets and forecasts are for educational purposes only and may not be reliable for investment decisions. Use this information at your own risk. This is not an offer to buy or sell stocks. Dailybulls.in and its authors are not liable for any losses. It is not investment advice; seek professional advice before making any investment decisions. Exercise caution and be informed when investing.

WhatsApp Join Free Group!

Leave a Comment