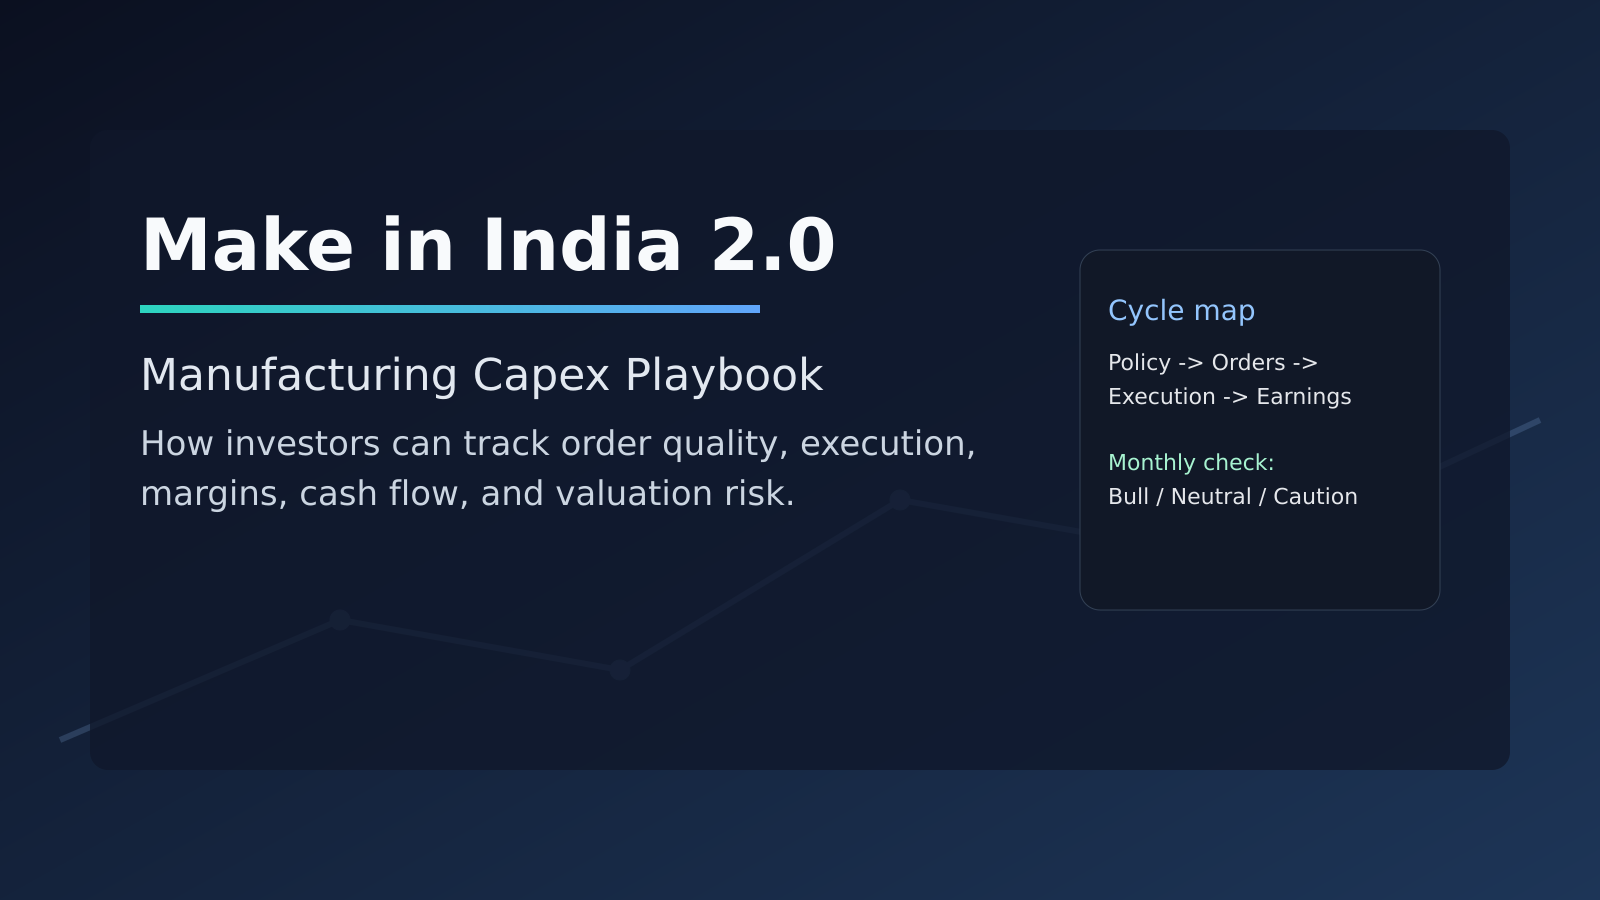
Make in India 2.0 Playbook: How to Track India’s Manufacturing Capex Cycle as an Investor
Quick take
- This can become a multi-year theme, but returns will not be linear.
- Policy headlines are step one. Investors make money only when execution, margins, and cash flow follow.
- Track the full chain: policy -> tender -> orders -> execution -> revenue -> margin -> cash flow.
- In this theme, “big order book” is not enough.
- Working capital and cash conversion are the real filters.
Cycle context
Manufacturing capex themes can look strong on headlines and still disappoint on delivery. The right way to track this cycle is through execution, margins, and cash conversion.
Review the indicators monthly to classify the cycle as improving, flat, or weakening.
Is Make in India 2.0 investable? Use this evidence table
| Signal | Why it matters | What to track | Current read |
|---|---|---|---|
| Policy to execution continuity | Improves demand visibility | Budget direction, scheme execution | Positive, but execution-led |
| Manufacturing investment momentum | Supports multi-year order flow | New capex announcements, project awards | Improving in pockets |
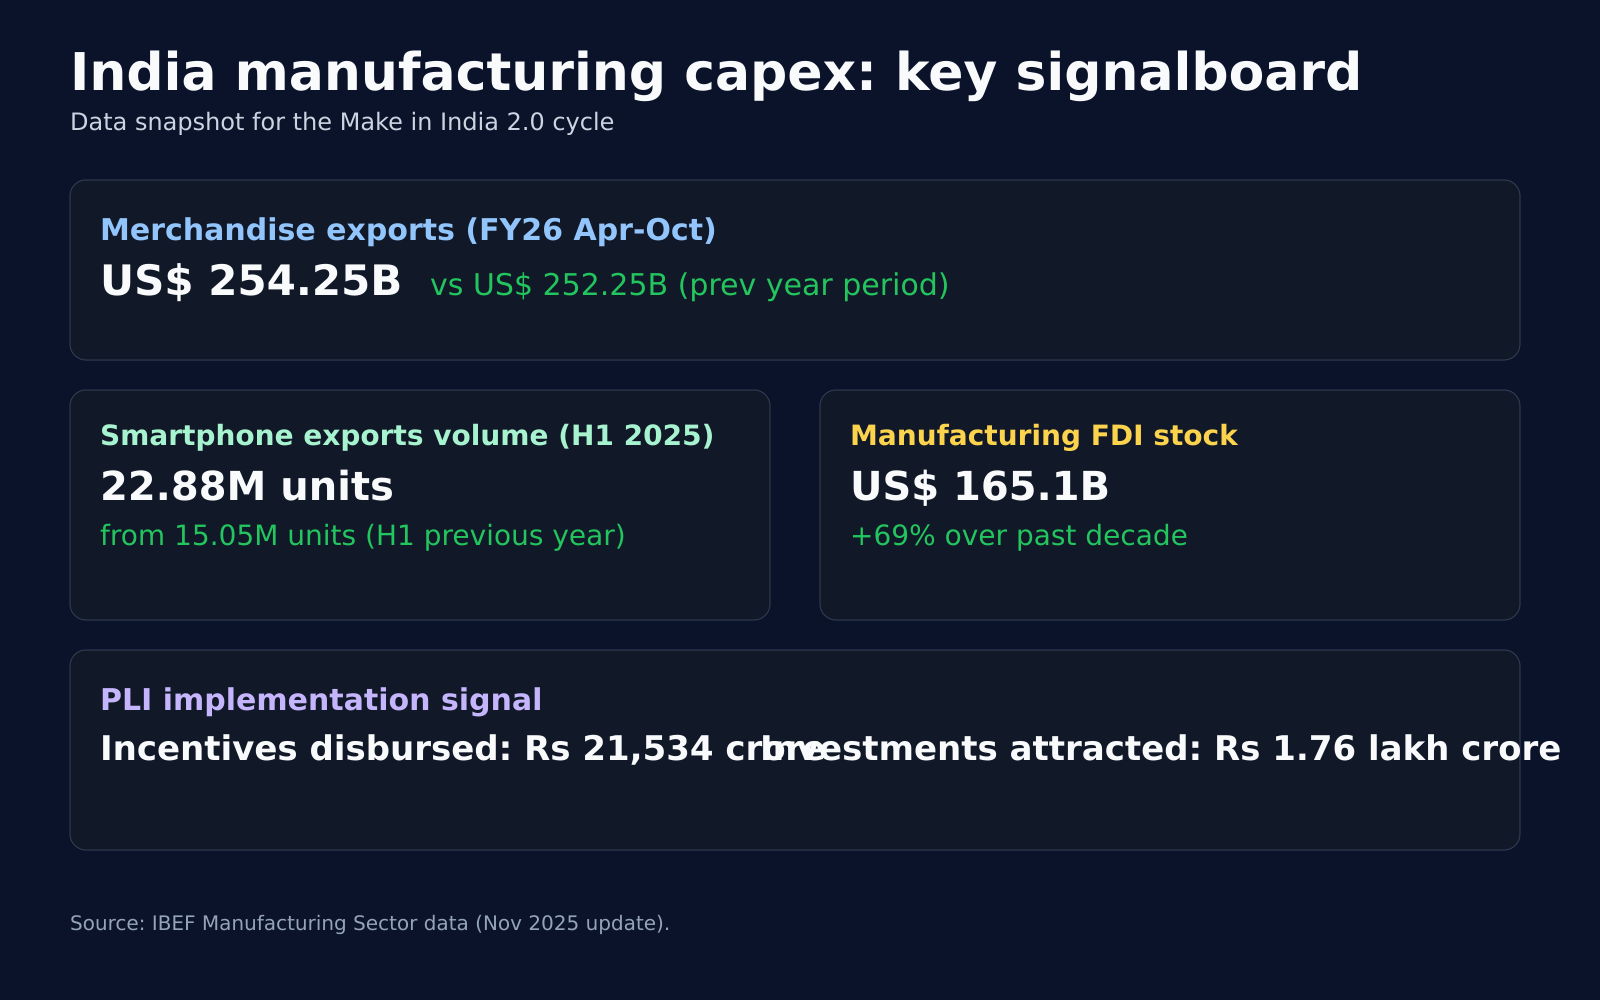
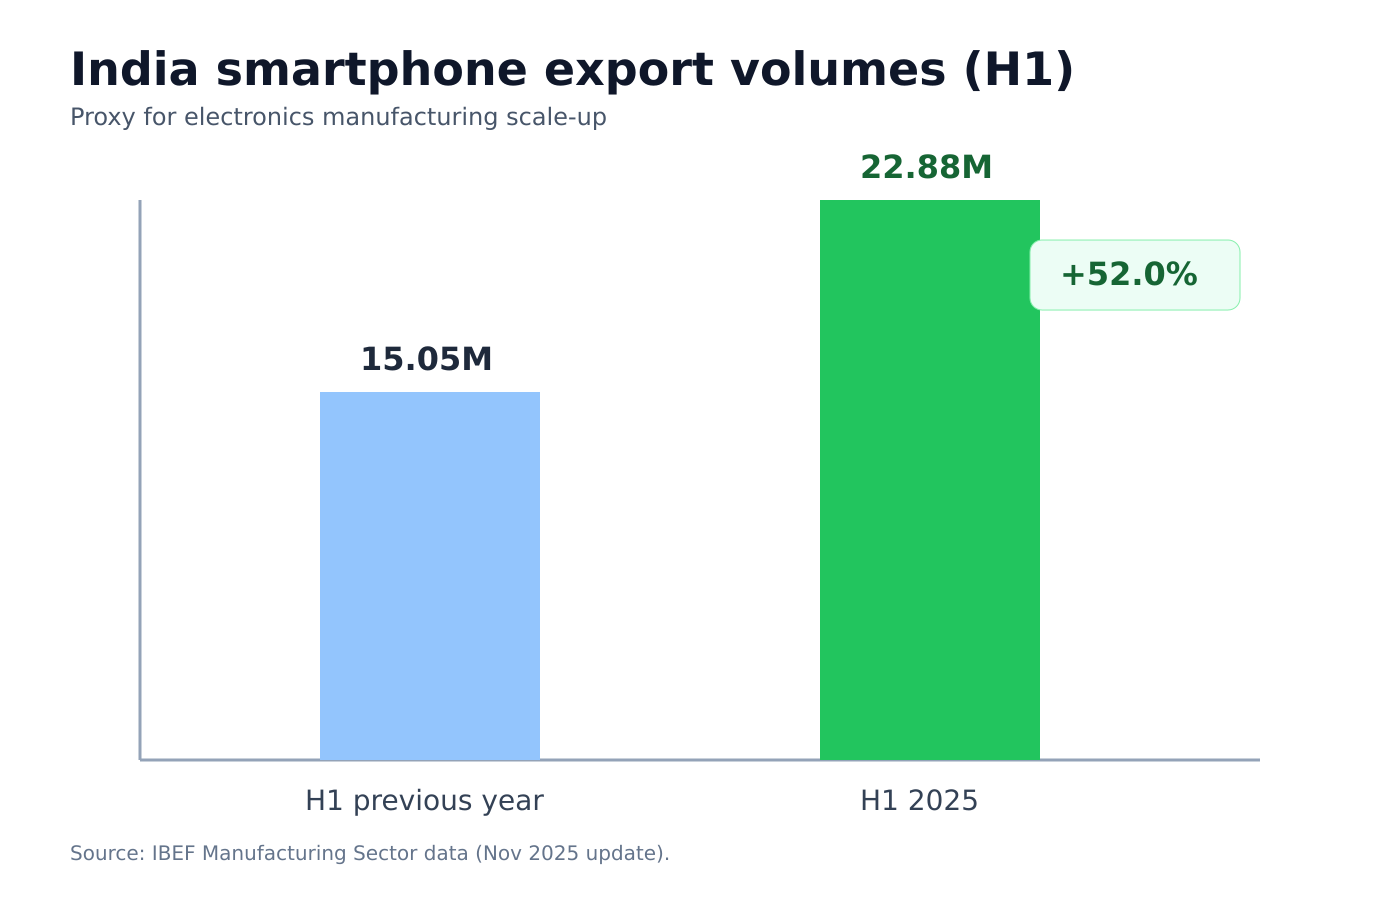
| Export-linked manufacturing scale-up | Adds external demand support | Electronics/engineering export trends | Mixed, leader-heavy |
| Order inflow in capex-linked names | Can improve earnings visibility | Order inflow, executable order mix | Needs quality filter |
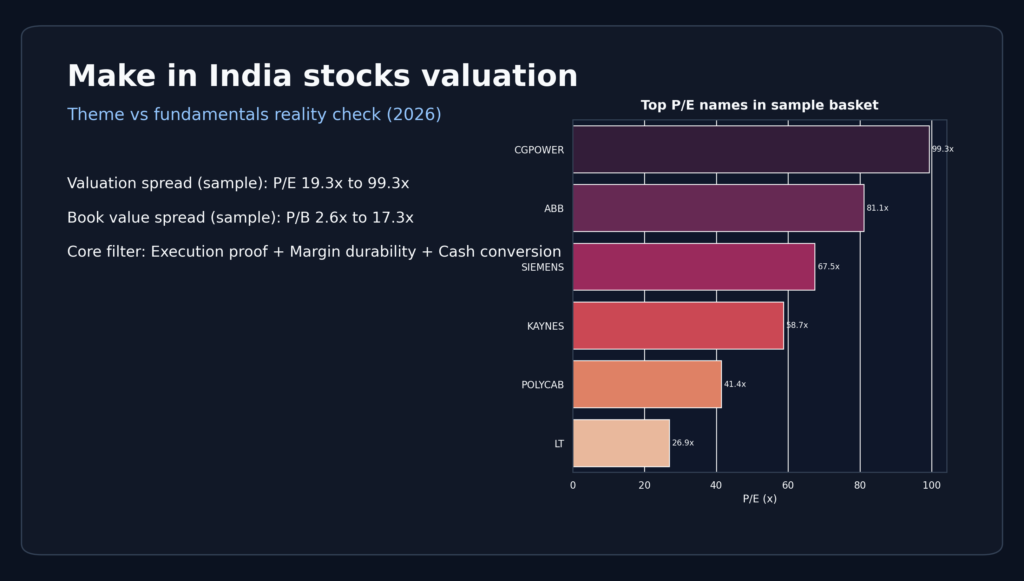
| Valuation discipline | Protects returns | Multiples vs earnings delivery | Critical now |
The capex-to-earnings chain
Do not skip steps. The market often prices in the end result before the middle part is delivered.
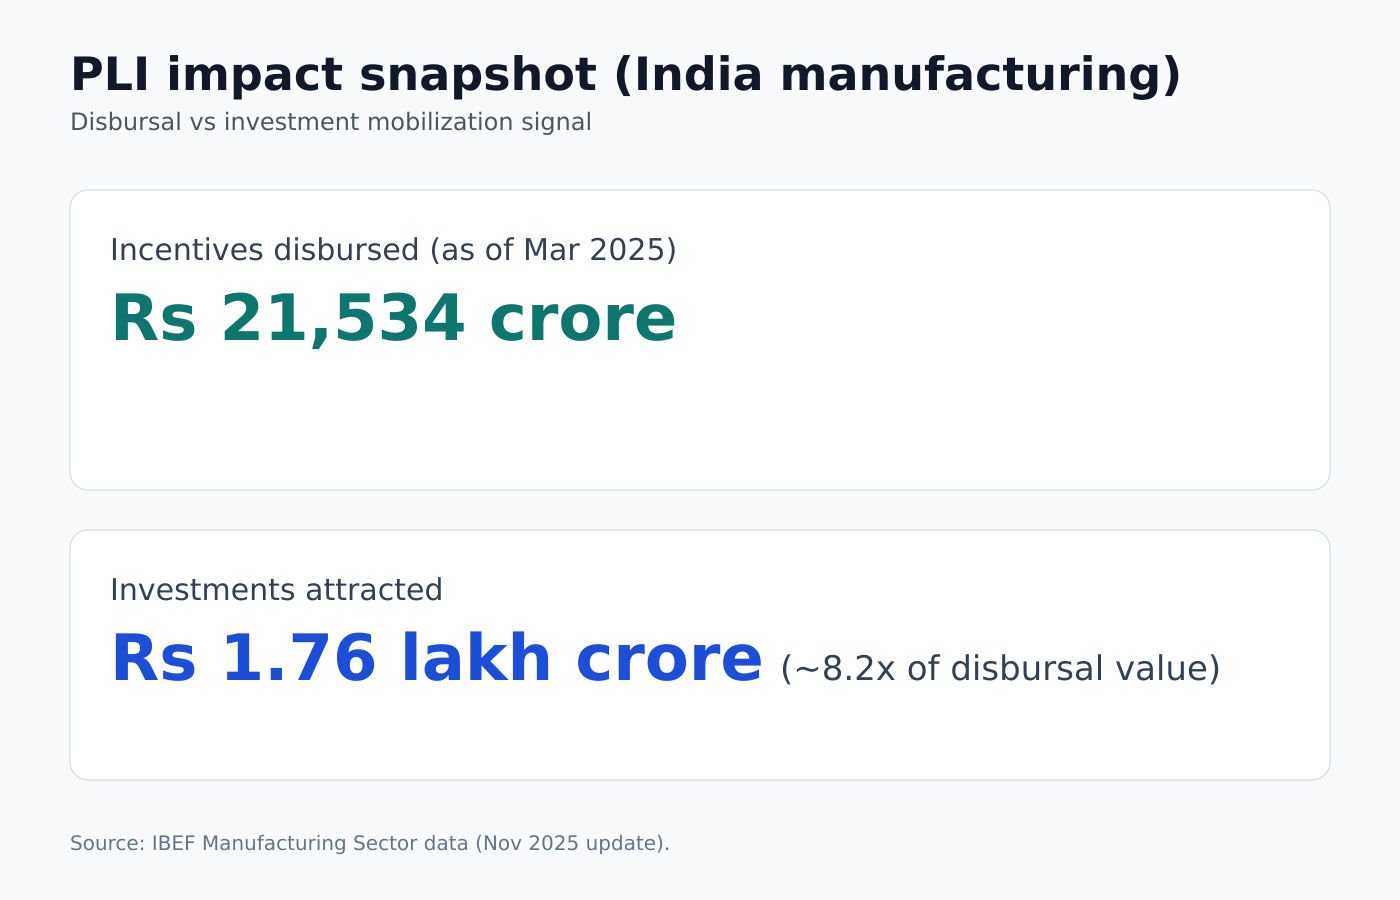
- Policy and incentives
- Tendering and approvals
- Order inflow
- Execution
- Revenue recognition
- Margin realization
- Cash conversion
- Re-rating or de-rating
If step 4, 6, or 7 weakens, returns can disappoint even with strong headlines.
Five mini-cycles inside this theme
1) Capital goods
Base layer of the cycle.
- Book-to-bill trend
- Executable order mix (12-24 months)
- Receivable days and CFO trend
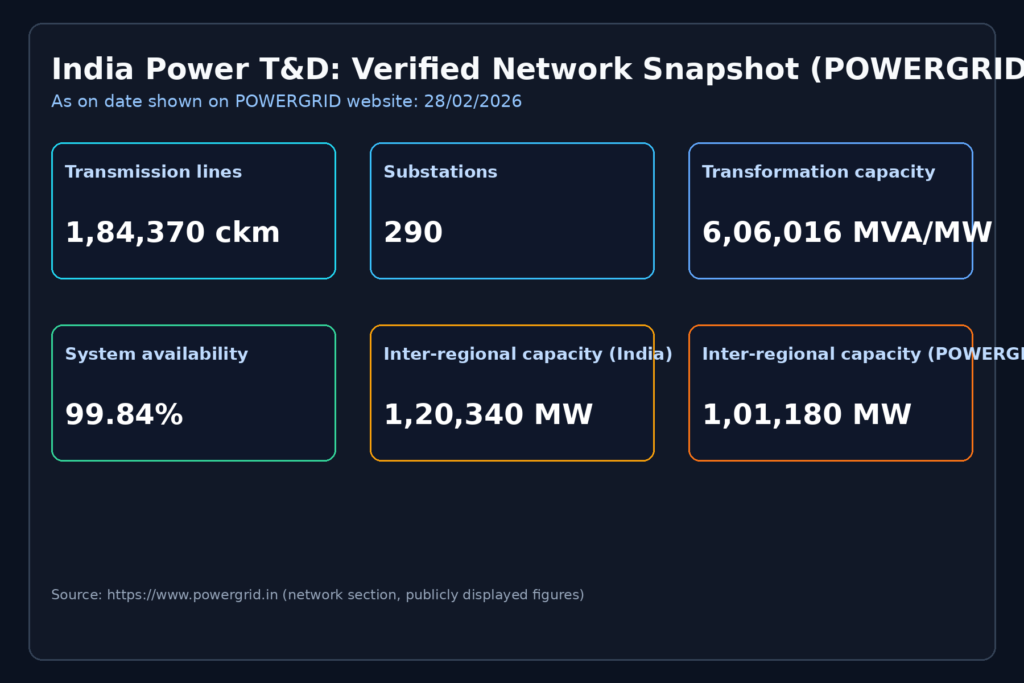
2) Power T&D and grid equipment
Long runway possible, but execution bottlenecks are real. For a full deep dive, see our India Power T&D execution bottlenecks playbook.
- Project award pace
- Equipment supply tightness
- Execution timelines
3) Defence and public procurement manufacturing
Can provide visibility, but depends on procurement pace and conversion quality.
- Contract award velocity
- Milestone conversion to revenue
- Budget quality and continuity
4) Electronics/EMS and China+1
Strong opportunity, but concentration risk matters.
- Export growth quality
- Customer concentration
- Domestic value-add progression
5) Industrial automation
Less noisy theme, often better quality when private capex sustains.
- Management commentary on automation demand
- Productivity-led margin impact
- Repeat order behavior
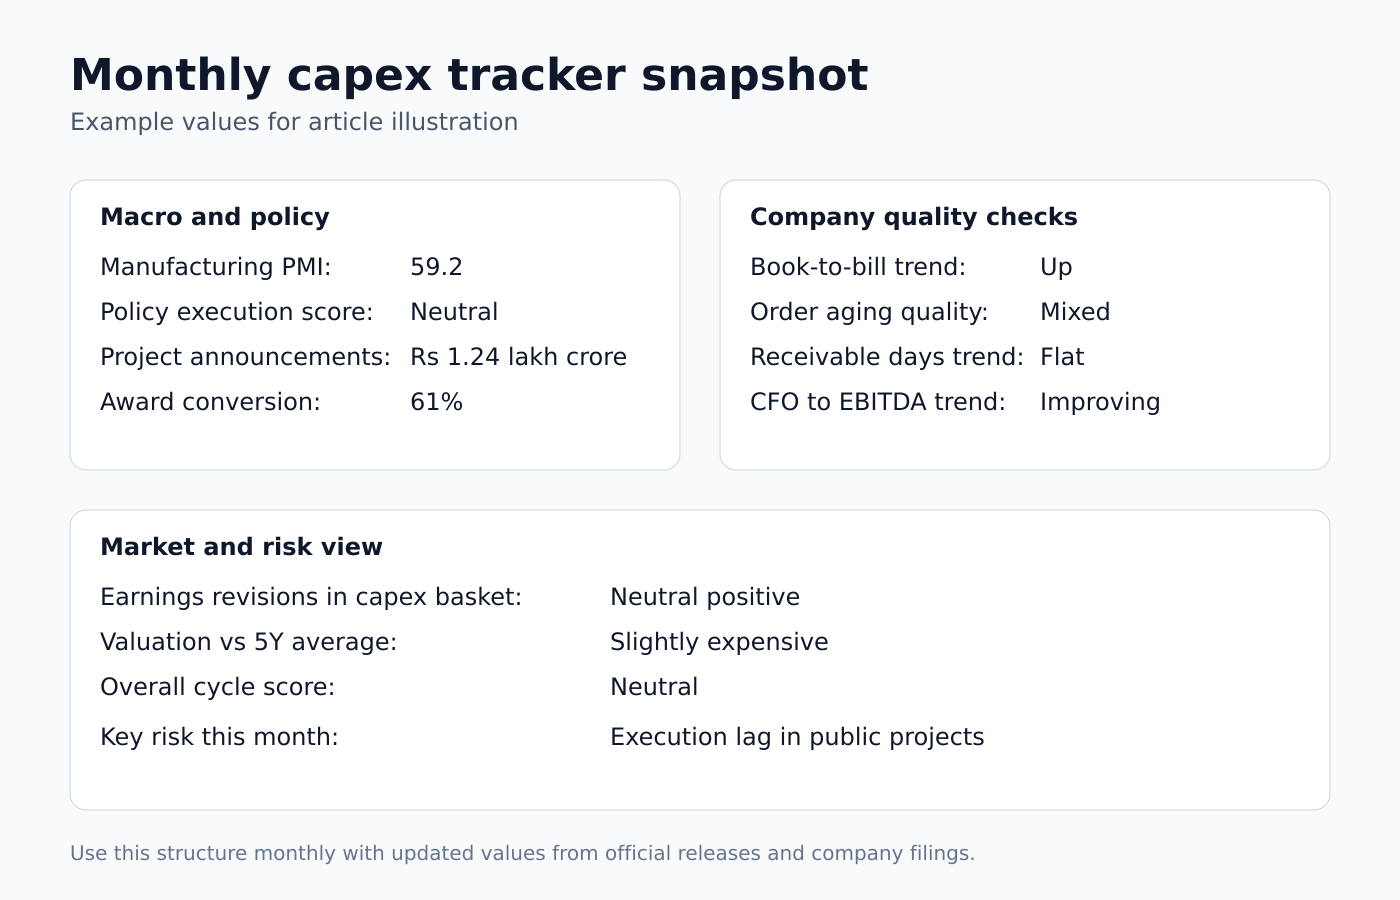
Monthly dashboard (simple format)
A) Macro and policy
- Manufacturing PMI trend (3m/6m)
- Policy execution updates
- Core capex-related indicators
B) Project pipeline
- Tender value
- Award conversion
- Award-to-execution lag
C) Company quality
- Book-to-bill
- Order aging
- EBITDA trend on execution business
- Receivable days / working capital days
- CFO/EBITDA trend
D) Market setup
- Earnings upgrades/downgrades
- Relative valuations vs history
- Liquidity and participation in mid/small-cap names
Final monthly score: Bull / Neutral / Caution.
Risk dashboard
- Execution delays
- Working capital stretch
- Margin pressure in fixed-price contracts
- Procurement or fiscal pacing issues
- Overvaluation risk
- External demand softness for export-facing players
How to use this in portfolio decisions
- Update the table once a month.
- Score each mini-cycle.
- Check if order growth is converting into cash.
- Compare business delivery vs valuation.
- Size exposure only after this review.
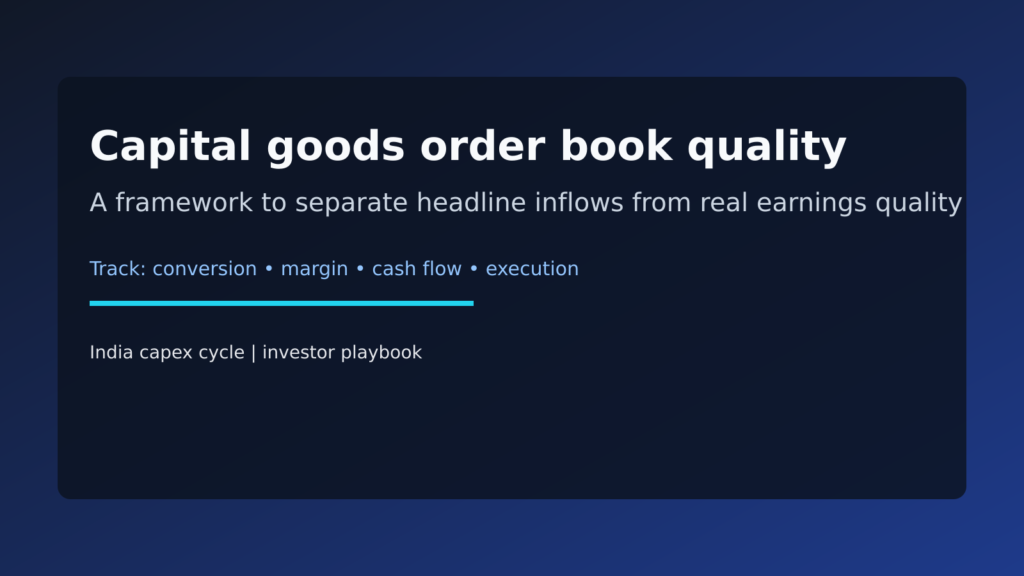
For detailed stock-level analysis, start with our capital goods order book quality framework.
Upcoming deep dives
- Capital goods order book quality
- Power T&D execution bottlenecks
- Valuation reality check in capex themes
- Defence manufacturing pipeline quality
- Rail-linked manufacturing beneficiaries
- EMS export sustainability
FAQ
Is this a short-term trade or long-term theme?
Potentially multi-year, but cyclical. Treat it as a monitored cycle, not a one-way bet.
Most important metric?
Cash conversion quality.
Why is order book growth not enough?
Because execution, margins, and collections decide final earnings quality.
Which segment to track first?
Start with capital goods quality indicators, then move to power T&D and valuation checks.
Share this insight
Spread the Alpha
Related Articles
More ideas that align with your trading playbook.
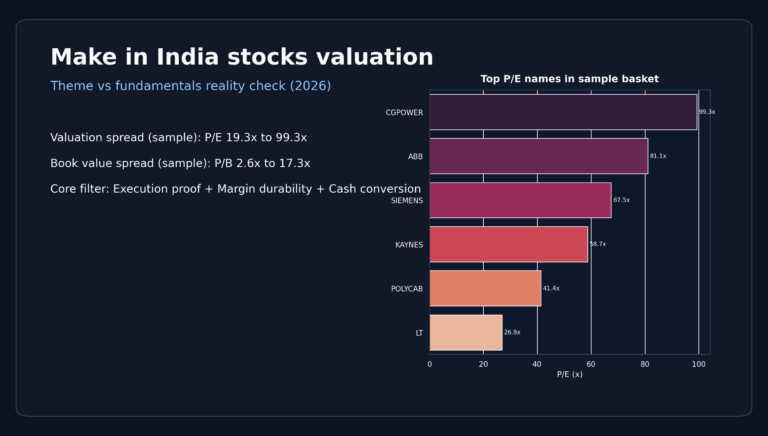
Make in India Stocks Valuation: Theme vs Fundamentals Reality Check (2026)
The Make in India manufacturing story is real. The valuation story is where things get tricky. In parts of the capex basket,…

India Power T&D Execution Bottlenecks: Investor Playbook (2026)
Quick take The india power t&d execution bottlenecks story is simple: the capex runway is large, but returns depend on execution quality,…

India Capital Goods: How to Judge Order Book Quality (2026)
Quick take Order-book size is just a starting signal. Better stock outcomes usually come from three things: conversion quality, margin quality, and…