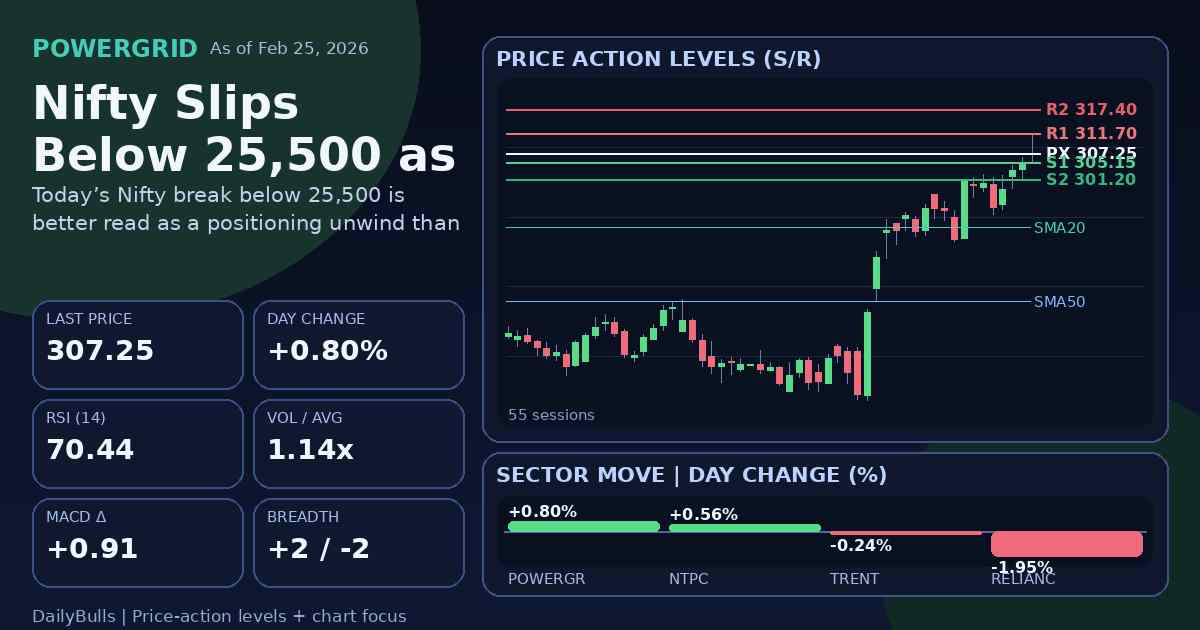
Nifty Slips Below 25,500 as Crude Rises, Global Cues Weaken
A positive open flips into a sub-25,500 afternoon move as global cues soften and crude firms
On February 26, 2026, Indian equities opened on a firm note, and early market breadth showed broad participation. The early strength faded through the session. As intraday momentum weakened, benchmark gains narrowed and the Sensex moved about 250 points below its day’s high.
By around 13:11 IST, the Nifty slipped below 25,500, showing a clear reversal from the opening phase. A softer global risk tone and firmer crude coincided with the shift from early buying to visible profit booking. Late trade reflected a decisive intraday turn, not a flat drift.
Pressure concentrates in power and retail-heavy names rather than a uniform market slide
The selloff pattern was concentrated, not broad-based. Pressure was more visible in power names and retail-heavy counters with meaningful index weight, while other parts of the market were mixed.
TRENT remained one of the clearer weak points in retail, and power names were also under pressure in the afternoon leg. This concentration amplified index weakness even without a full-market sector-wide decline. The benchmark move was shaped by where selling landed, not by uniform deterioration across segments.
The decline reads as position unwinding, not a clean fresh trend fracture
- Primary reading: The break below 25,500 appears more like position unwinding than a fresh structural trend break, with weaker global sentiment and firmer crude acting as immediate triggers.
- Alternative view: This may have been a macro-led intraday dip that can reverse if external sentiment improves.
- Condition that invalidates the unwinding view: Nifty reclaims and holds above 25,500 for two consecutive sessions, while POWERGRID and NTPC keep outperforming without RSI cooling, and RELIANCE plus TRENT reclaim and hold above both SMA 20 and SMA 50.
A single comparison matrix shows overbought defensives versus below-trend heavyweights
The market move above was on February 26, 2026, while the technical snapshot below is from the close on February 25, 2026.
| Ticker | Price date | Indicator date | Last traded price | Day change (%) | Average volume | RSI (14) | MACD line | MACD signal | SMA 20 | SMA 50 | Trend position |
|---|---|---|---|---|---|---|---|---|---|---|---|
| POWERGRID | 2026-02-25 | 2026-02-25 | 307.25 | 0.80 | 12,512,499 | 70.44 | 9.8418 | 8.9279 | 290.10 | 272.83 | Above both SMA 20 and SMA 50 |
| NTPC | 2026-02-25 | 2026-02-25 | 384.90 | 0.56 | 10,125,309 | 70.78 | 8.6528 | 7.5471 | 366.20 | 348.88 | Above both SMA 20 and SMA 50 |
| TRENT | 2026-02-25 | 2026-02-25 | 3,922.00 | -0.24 | 578,259 | 40.98 | 5.7986 | 27.4189 | 4,052.58 | 4,048.24 | Below both SMA 20 and SMA 50 |
| RELIANCE | 2026-02-25 | 2026-02-25 | 1,400.90 | -1.95 | 9,511,961 | 42.15 | -9.6795 | -9.9214 | 1,428.28 | 1,468.13 | Below both SMA 20 and SMA 50 |
The split is clear. POWERGRID and NTPC had RSI (14) above 70 and remained above both moving averages, showing stretched but still strong defensive positioning. RELIANCE and TRENT were below SMA 20 and SMA 50, showing weaker trend support in key heavyweights. TRENT also had MACD line below MACD signal, while RELIANCE had both MACD values in negative territory. This side-by-side structure supports uneven internal resilience.
Intraday evidence leaves clear limits on confidence
Confidence remains bounded because this is one intraday reversal sequence, not multi-session confirmation of structural change. The time window did not show a fresh RBI, SEBI, or government policy trigger that could independently explain the move. It also did not show a new high-impact single-company shock in a major benchmark heavyweight.
Attribution therefore remains conditional: external risk cues explain the timing, while internal fragility explains the transmission strength. The unwinding view stays provisional and can be invalidated by a sustained reclaim of 25,500 with simultaneous trend repair in the identified heavyweights.
The day’s move reflects external risk pressure interacting with prior internal strain
The factual sequence was a strong open, a drop from intraday highs, and an afternoon move below 25,500, with pressure concentrated in power and retail-heavy names. The prior-close technical comparison shows stretched defensive leaders versus below-trend heavyweights.
The evidence-backed reading is that external risk pressure met pre-existing internal strain. What is established is the reversal path and concentration of weakness. What remains unproven is whether that strain will persist beyond this session.
Share this insight
Spread the Alpha
Related Articles
More ideas that align with your trading playbook.

Stocks to Watch Tomorrow in India if Global Gas Risk Cools
Stocks to watch tomorrow in India if global gas risk cools If global gas-risk premium softens overnight, Indian equities may react through…

India Market Stress Playbook: Oil, Rupee, VIX, Gas and Banks
India Market Stress Playbook: Oil, Rupee, VIX, Gas and Banks This hub connects our recent India market coverage into one working framework.…

Bank Nifty Fall: Liquidity Stress or Earnings Reset?
Bank stocks led the downside in a high-volatility session. The move was sharp, but classification is important. For next-session sector confirmation, see…