Sector Heatmap: IT Leads, METALS Trails
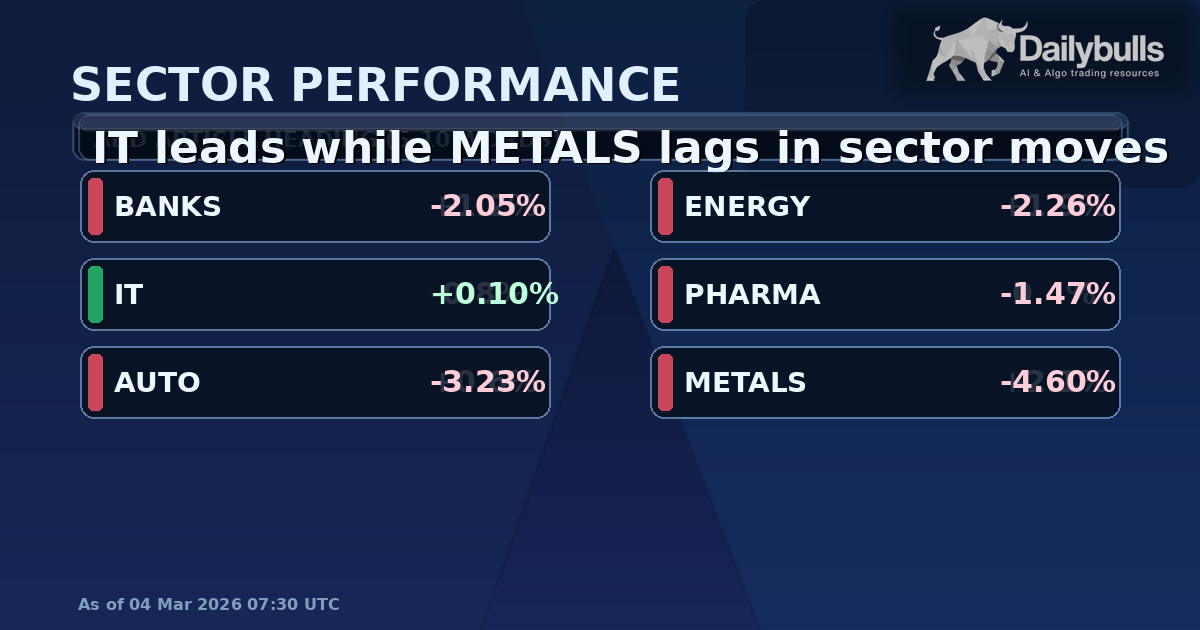
Indian sector indices closed with mixed and differentiated performance in the latest session, reinforcing that market internals remain more informative than index direction alone. The strongest one-day move came from IT (+0.10%), while METALS (-4.60%) was the weakest among tracked sectors. Such wide spread between top and bottom performers is typically associated with active style and allocation rotation rather than uniform risk-on or risk-off participation.
Daily sector spread matters because it reveals where risk is being absorbed and where it is being reduced. When leadership shifts quickly between defensives, cyclicals, and rate-sensitive pockets, the probability of choppy index behavior rises even if aggregate benchmark moves look straightforward. In practical terms, broad narratives can miss what the internals are signaling: dispersion often increases before index trends stabilize.
On a 5-session basis, the best relative trend sits with IT (+0.83%), while the weakest weekly trend is AUTO (-4.64%). Over roughly 1 month, leadership is currently with PHARMA (+1.89%), and the laggard is IT (-21.52%). If weekly and monthly leaders are different, it usually indicates transition conditions where short-horizon rebounds and pullbacks can be sharper than normal.
Volatility dispersion is equally relevant: METALS is showing the highest recent realized volatility at about 32.18% (10-session annualized estimate), while BANKS is relatively calmer near 14.67%. This volatility split helps explain why headline sentiment can feel unstable: price movement intensity is uneven across sectors, so aggregate readings may understate where risk is concentrated.
Range positioning adds additional structure. BANKS is trading within an approximate 20-session band of 58614.35 to 61550.80. IT is trading within an approximate 20-session band of 30053.50 to 36345.65. AUTO is trading within an approximate 20-session band of 26652.85 to 28693.40. ENERGY is trading within an approximate 20-session band of 35633.00 to 37181.80. PHARMA is trading within an approximate 20-session band of 21961.35 to 23301.65. METALS is trading within an approximate 20-session band of 11705.70 to 12448.00. Comparing these ranges with current daily momentum helps identify whether each sector is near breakout, breakdown, or mean-reversion territory in the short term.
Another useful read-through is how leadership quality is evolving rather than just where returns printed today. If the top-performing sector is also among the stronger weekly trends, momentum confirmation is higher; if daily winners are mostly from previously weak groups, the move may reflect short-covering or temporary mean reversion. Likewise, when the weakest daily sector is also the weakest on a rolling monthly basis, that can signal persistent relative weakness rather than a one-session event. This persistence-versus-reversal lens improves interpretation of raw heatmap moves and helps separate structural trend behavior from noise-driven rotation.
Sector snapshot (1D): IT +0.10%, PHARMA -1.46%, BANKS -2.05%, ENERGY -2.25%, AUTO -3.22%, METALS -4.60%. This note is designed to provide fuller context even on days with limited single headline catalysts by combining cross-sectional returns, rolling momentum, volatility dispersion, and range structure into one publishable market-internals read.
Data timestamp: 04 Mar 2026 07:30 UTC.
Share this insight
Spread the Alpha
Related Articles
More ideas that align with your trading playbook.
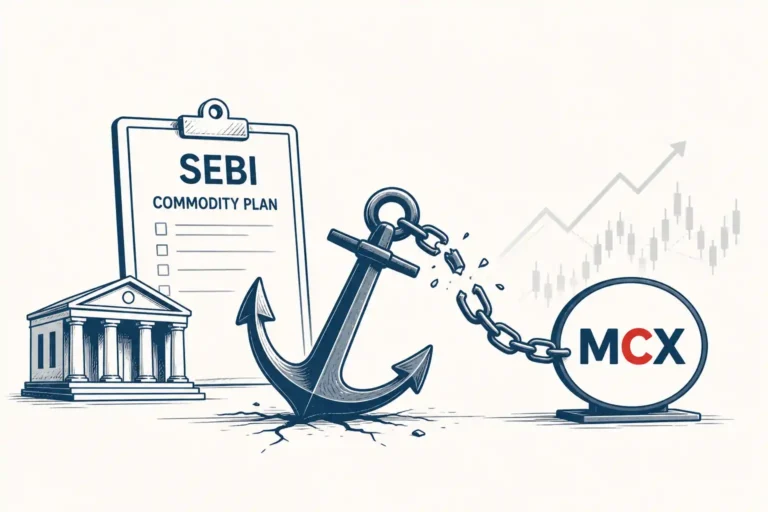
SEBI’s Commodity Plan Just Lost Its Institutional Anchor. What It Means for MCX
SEBI wanted banks, insurers, and eventually pension funds to deepen India's commodity derivatives market. RBI and IRDAI are not inclined to allow…

India’s Data Center Power Trade: Which Stocks Benefit First if AI Infra Spending Accelerates?
India's AI buildout may look like a software story, but the first listed winners could emerge from transformers, cables, switchgear, backup power,…
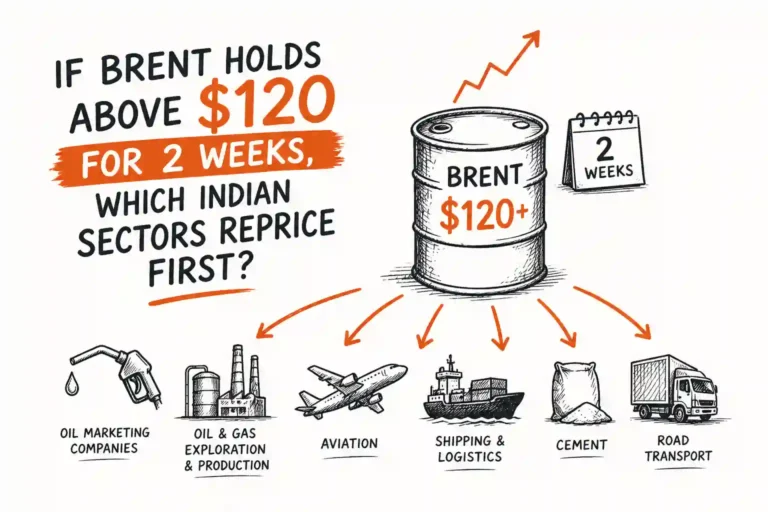
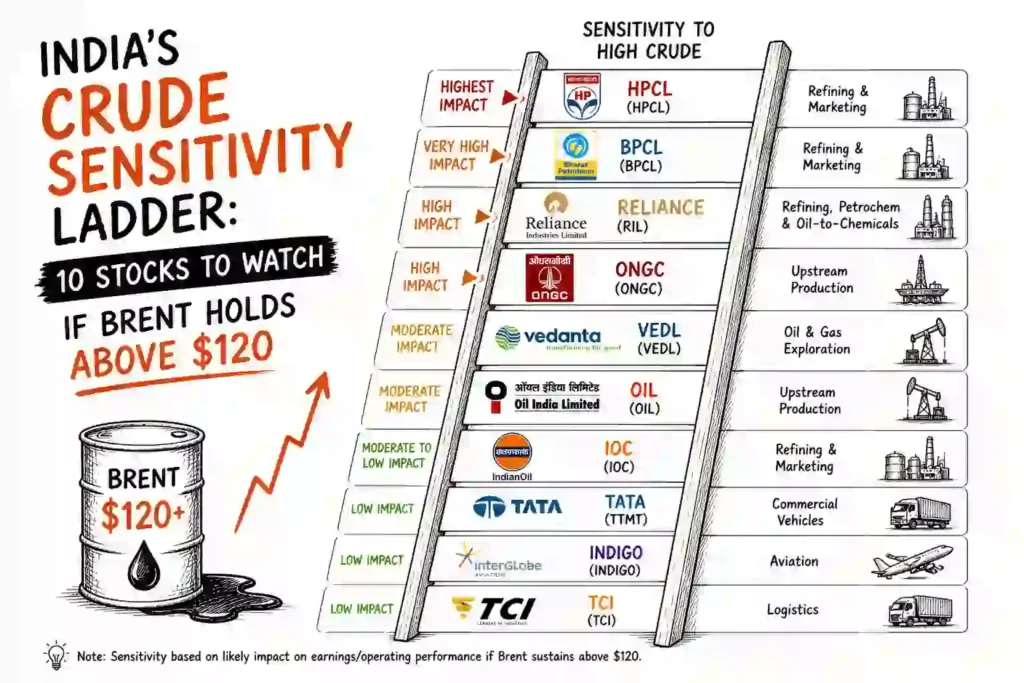
If Brent Holds Above $120 for 2 Weeks, Which Indian Sectors Reprice First?
A one-day crude spike can be ignored. Two weeks above $120 Brent is different. At that point, Indian markets stop treating oil…
 DailyBulls (Arthashilpi Ventures) is a D-U-N-S verified company.