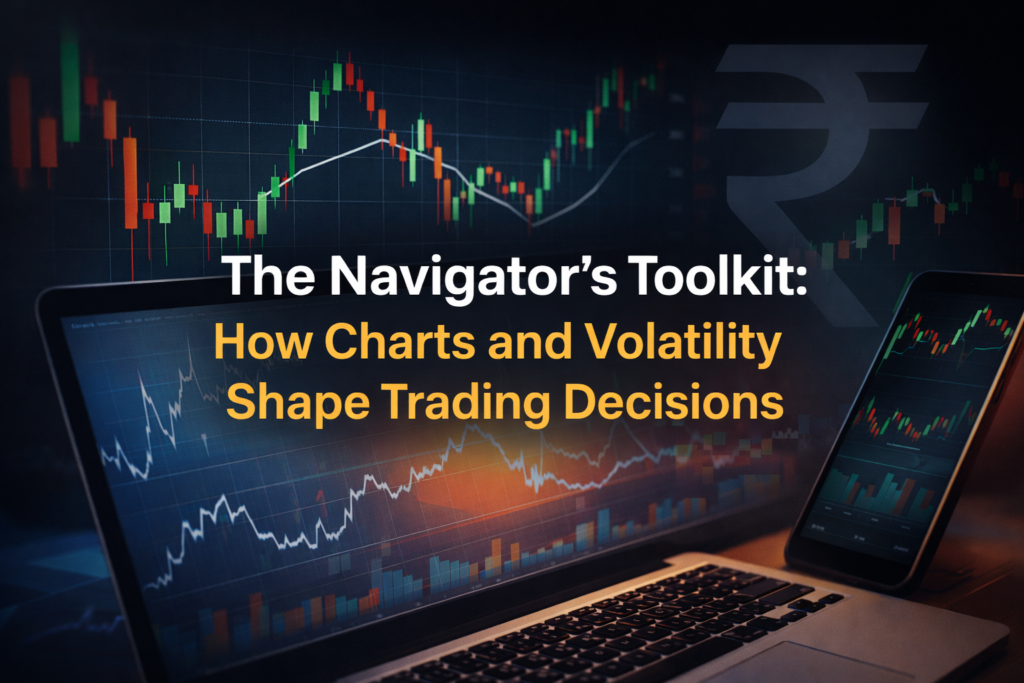
It can be similar to going through a new place when handling the stock market. Although you know where you want to go, the road ahead is full of twists, turns, and unexpected traffic. Market charts and volatility indicators are the most important tools on a trader’s screen because they give them the information they need to make smart decisions and safely achieve their financial goals. They turn the market’s mayhem into a doable road.
Reading the Road Map: The Power of Market Charts
Consider a market chart as your trade journey’s road plan. It tells the tale of an asset’s previous success by visually showing its price movement over time. In addition to numbers, a trader can see patterns, trends, and ideas when studying a nifty live chart. An upward-sloping line signifies a bull run, while a downward trend predicts a bear market. By employing critical levels of support and resistance, which act as rest stops or obstacles, a trader may determine where the price may find a bottom or reach a peak. Just like a driver expects a sharp bend ahead by looking at the road, traders can guess possible market action by studying these charts.
Feeling the Bumps: Understanding Volatility Indicators
While charts show the direction, volatility indicators reveal the quality of the ride. They measure the choppiness or the “bumpiness” of the market, telling you how much the price is likely to swing. Nowadays, the most well-known of them is the India Vix, also referred to as the “Fear Gauge.” This one figure tracks the market’s expectation of a big price swing over the next 30 days rather than guessing whether the market will rise or fall. A high VIX denotes a hard, choppy road ahead, whereas a low VIX suggests a peaceful, smooth roadway. It serves as the trader’s weather radar for market storms, helping them in expecting possible instability.
Combining Signals for Smarter Navigation
The real magic happens when a trader combines the information from both their map and their weather radar. Imagine seeing a bullish pattern on your nifty live chart, which looks like a green light to buy. On the other hand, if the India Vix is abnormally high today, it is a tip to approach carefully. This mixture implies that there is a considerable possibility of a sudden, dramatic change even though the road may be fine. An educated trader might elect to join a lower position, set a tighter stop-loss, or wait for the volatility to pass. They go from only reacting to the market to effectively controlling their risk and strategy by mixing the two ways.
Key Pointers for Traders
- Charts are your “What”: They show the direction and potential price levels.
- Indicators are your “How”: They show the risk and the potential intensity of the move.
- Never rely on one tool: A holistic view is always superior to a single data point.
- Manage risk by using the India Vix today, which is a gauge of market worry rather than a guide.
In the end, no tool can ensure a smooth journey, but how well you use them can make the difference between being a lost driver and a skilled guide. These important tools are easily available through sites offered by firms such as Angelone, allowing buyers to make smart choices in the constantly changing market.