
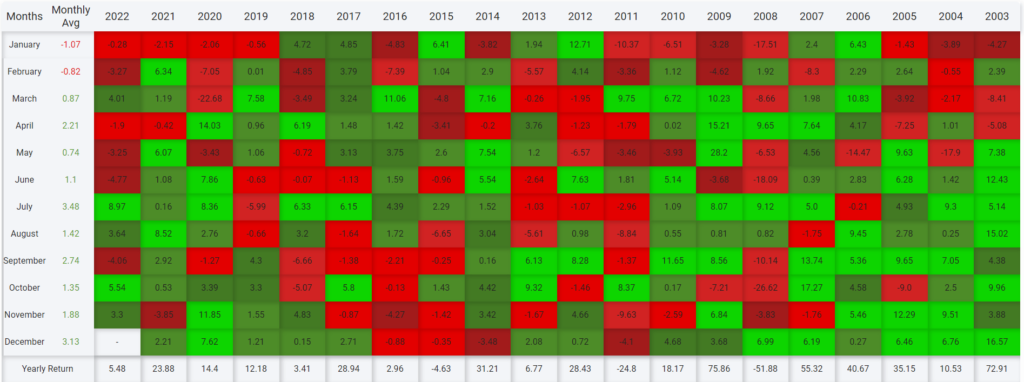
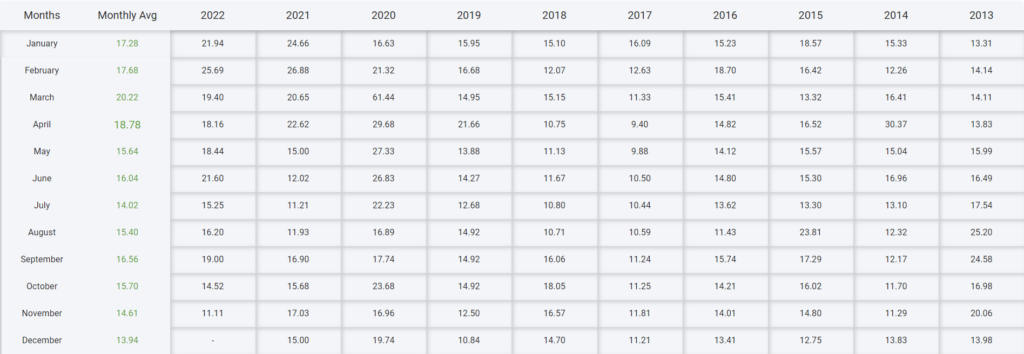
Best time to buy stocks – Seasonality in Indian Stocks
Pranay
Contributor
In this article, we will talk about seasonal tendencies in Indian Stocks. We will aim to find out if such recurring patterns in terms of returns do exist and if it does, which are the best months to buy and sell stocks. While there is no such Sure Shot recurring pattern in the Market, certain trends do often occur based on the time of the year. These tendencies are not usually stronger than overall market conditions, but they do play into price fluctuations.
Before everything let’s understand what seasonal tendencies mean. Seasonality is the tendency for securities to perform better during some periods and worse during others. This Market cycle may be seen in Daily, weekly, monthly, and even multi-year timeframes. For our analysis, we will consider 6 months span.

Definitely, there are some seasons when stocks seem to perform better in long run, but this should be used as an overall portfolio management and not completely depend on this.
To analyze seasonality trends in the stock market we will focus mainly on Nifty index and use the following metrics:
- Monthly average return over a period of years.
- The average return of Jan-June and July-Dec.
If this feels confusing, I will try to simplify this in the next few lines. Let us analyze some charts.
Nifty Seasonality Trends - Monthy average

The above image shows Nifty’s Monthly Average returns from the past 10 years 2013 – 2022. The second column ‘Monthly average’ shows the average return of Nifty from 2013-2022 in the respective Months. Let’s break the year into 2 semesters.
We are using a simple formula to calculate the average return of 6 monthly period
Sum of monthly average ÷ Return number of months
Observations:
- Average return from Jan-June (1st 6 months) is 3.896 = 0.64
- The average return of the next 6 months is 9.1/6 = 1.51. This is 2.35 time higer then the returns in Jan-June!
Buy in July Sell in January

Let’s also have a look on a larger scale. The above chart is for the monthly average return for 20 years.
- The average return of nifty for first 6 months is 3.03/6 = 0.505%
- For next 6 months it is 14/6 = 2.33% which is again, almost 4.65 Times higher!
Highest returns on average occured in July whereas, January gave the least returns. The same is true with Mid Cap, Small Cap and Banknifty.
What about Banknifty, mid-caps and Small-Caps?

This is what the Banknifty Index has done in the last 5 years. We see a gradual increase from July to Nov-Dec while in the first couple of months the Market seems to be declining.
MARKET VOLATALITY

This chart contains IV (India VIX) monthly average data from 2013-2022. By our observations, IV peaks out near April-June. To get an in-depth idea of how IV affects price check out this article
Share this article
Share this insight
Spread the Alpha
If this analysis helped you, pass it along to your trading desk or community.
Related Articles
More ideas that align with your trading playbook.

Tata Elxsi Analysis – Best time to buy or wait?
In this article, we will analyse the technical and fundamental details of Tata Elxsi, an IT stock from the house of Tata…

7 ways to save taxes on Futures and Options trading
Who wouldn't want to save on those taxes? Especially in trading when the Turnover can easily cross tens of crores. Here are…

5 Best Penny Stocks in India to invest in 2023
Penny stocks can be a good investment if you are starting with the stock market or if you want to diversify your…


Great post 👍
Great post. Prakash steelage looks very good. I am holding it too but now will add more quantity.