We backtested Opening Range Breakout (ORB) Strategy: Check how it achieved 71.4% Winrate on Nifty
Between July 28 and October 31, 2025, we tested the opening range breakouts strategy popularly known as ORB on Nifty futures with one constraint: one trade per session. No additional entries after a breakout filled, even if that trade exited early. This popular algo strategy was tested on a 5 min timeframe for intraday trades.
The strategy was backtested on 4 different variants of exit. Keeping the entry logics the same we generated 42 entry signals. The results separated what sounds good from what actually makes money.
30 mins ORB Strategy for algo trading
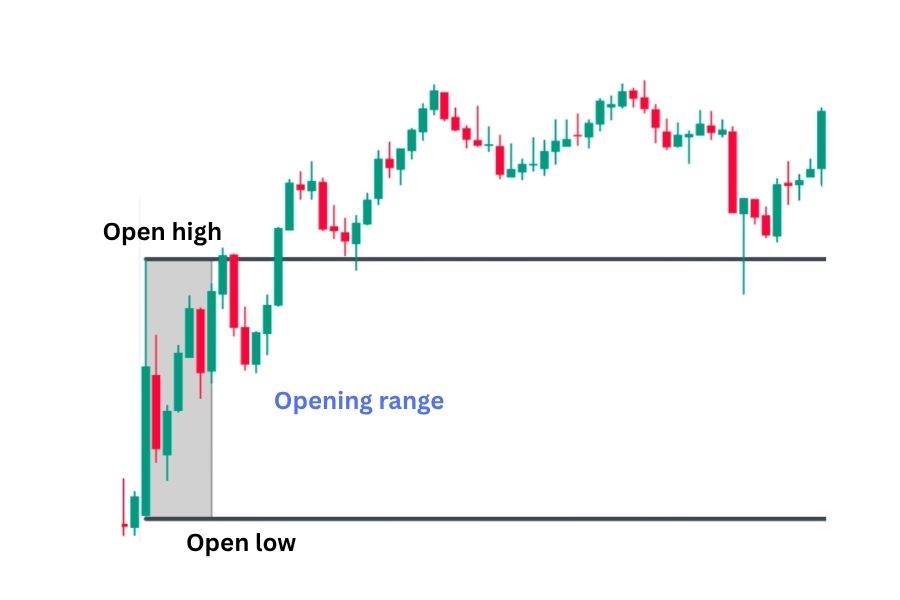
Opening range: First 30 minutes (six 5-minute bars) established the opening range. Mark the high and low.
Entry: Go long when price breaks above the OR (opening range) high. Entry at the next bar’s opening price.
Stop: We take SL when price is below opening-range low (baseline), or entry − 1.5×ATR14 (ATR based stop)
Target: 2R from entry.
Trail: After +1R, stop trails to close − 1.5×ATR14.
One entry per session. Period. If you entered, you couldn’t take another long signal that day even if the first trade closed early.
Results of Four Variants from 30 mins ORB strategy
| Variant | Trades | Win% | Avg R | Return | Max DD | Avg Hold |
| OR Low + ATR Trail | 42 | 57.1% | 0.16 | 1.09% | -1.58% | 195 min |
| ATR(14) Stop | 42 | 50.0% | 0.02 | -0.16% | -0.93% | 79 min |
| RSI ≥70 Exit | 42 | 71.4% | 0.18 | 1.54% | -0.62% | 81 min |
| Fixed 1.5R Cap | 42 | 57.1% | 0.28 | 2.88% | -1.02% | 216 min |
Variant 1: Opening Range Low + ATR Trail

42 trades. 24 winners, 18 losers.
57.1% win rate. 0.16 average R. 1.09% compounded return. -1.58% max drawdown.
Sample Trades:
| Entry Date | Entry Price | Exit Date | Exit Price | P&L | Return % | Exit Reason |
| 2025-07-28 | 24906.60 | 2025-07-28 | 24751.00 | -155.60 | -0.62% | stop_hit |
| 2025-07-29 | 24711.70 | 2025-07-29 | 24744.50 | 32.80 | 0.13% | trail_gap |
| 2025-08-04 | 24727.00 | 2025-08-04 | 24800.00 | 73.00 | 0.30% | end_of_day |
| 2025-08-07 | 24615.10 | 2025-08-07 | 24710.00 | 94.90 | 0.39% | end_of_day |
| 2025-08-11 | 24499.00 | 2025-08-11 | 24596.70 | 97.70 | 0.40% | trail_gap |
| 2025-09-12 | 25158.00 | 2025-09-12 | 25221.40 | 63.40 | 0.25% | target_hit |
| 2025-10-16 | 25529.00 | 2025-10-16 | 25636.00 | 107.00 | 0.42% | trail_gap |
| 2025-10-17 | 25626.70 | 2025-10-17 | 25696.10 | 69.40 | 0.27% | target_hit |
When the opening-range low as a stop, a touch above 57% winrate was achieved. Stops held wide enough. Two trades hit 2R. Most closed at day’s end with modest profits.
Longer average hold (195 minutes) meant winners had room to develop. Trailing stop adapted once positions reached +1R.
Variant 2: ATR(14) Stop

42 trades. 21 winners, 21 losers.
50.0% win rate. 0.02 average R. -0.16% compounded return. -0.93% max drawdown.
Sample Trades:
| Entry Date | Entry Price | Exit Date | Exit Price | P&L | Return % | Exit Reason |
| 2025-07-28 | 24906.60 | 2025-07-28 | 24849.75 | -56.85 | -0.23% | stop_hit |
| 2025-07-29 | 24711.70 | 2025-07-29 | 24666.50 | -45.20 | -0.18% | stop_hit |
| 2025-07-30 | 24886.80 | 2025-07-30 | 24848.00 | -38.80 | -0.16% | stop_hit |
| 2025-08-04 | 24727.00 | 2025-08-04 | 24756.78 | 29.78 | 0.12% | trail_stop |
| 2025-08-07 | 24615.10 | 2025-08-07 | 24701.20 | 86.10 | 0.35% | target_hit |
| 2025-08-11 | 24499.00 | 2025-08-11 | 24599.07 | 100.07 | 0.41% | target_hit |
| 2025-09-12 | 25158.00 | 2025-09-12 | 25208.38 | 50.38 | 0.20% | target_hit |
| 2025-10-17 | 25626.70 | 2025-10-17 | 25709.46 | 82.76 | 0.32% | target_hit |
This variant failed. Nineteen trades stopped out (45% of all entries). ATR calculates recent volatility. Placing stop loss at entry − 1.5×ATR too early, any minor fluctuations caused our SL to hit early. Average hold was 79 minutes. The stop was too tight.
Variant 3: RSI ≥70 Exit

42 trades. 30 winners, 12 losers.
71.4% win rate. 0.18 average R. 1.54% compounded return. -0.62% max drawdown.
Sample Trades:
| Entry Date | Entry Price | Exit Date | Exit Price | P&L | Return % | Exit Reason |
| 2025-07-30 | 24886.80 | 2025-07-30 | 24909.10 | 22.30 | 0.09% | rsi_exit |
| 2025-07-31 | 24713.00 | 2025-07-31 | 24768.60 | 55.60 | 0.22% | trail_stop |
| 2025-08-07 | 24615.10 | 2025-08-07 | 24619.50 | 4.40 | 0.02% | rsi_exit |
| 2025-08-11 | 24499.00 | 2025-08-11 | 24593.80 | 94.80 | 0.39% | rsi_exit |
| 2025-08-13 | 24675.20 | 2025-08-13 | 24720.10 | 44.90 | 0.18% | rsi_exit |
| 2025-08-19 | 24980.30 | 2025-08-19 | 25030.00 | 49.70 | 0.20% | rsi_exit |
| 2025-10-17 | 25626.70 | 2025-10-17 | 25696.10 | 69.40 | 0.27% | target_hit |
| 2025-10-09 | 25203.10 | 2025-10-09 | 25263.00 | 59.90 | 0.24% | rsi_exit |
Highest win rate: only 12 losses across 42 trades. Twenty-seven trades exited on RSI overbought condition before reaching 2R target. Only one trade hit full target.
The tradeoff is clear: more frequent winners at lower R. 71.4% wins at 0.18R returns 1.54%. Higher win rate, smaller per-trade profit, lower drawdown.
Variant 4: Fixed 1.5R Cap (No Trailing)

42 trades. 24 winners, 18 losers.
57.1% win rate. 0.28 average R. 2.88% compounded return. -1.02% max drawdown.
Sample Trades:
| Entry Date | Entry Price | Exit Date | Exit Price | P&L | Return % | Exit Reason |
| 2025-07-29 | 24711.70 | 2025-07-29 | 24825.25 | 113.55 | 0.46% | target_hit |
| 2025-07-31 | 24713.00 | 2025-07-31 | 24844.85 | 131.85 | 0.53% | target_hit |
| 2025-08-04 | 24727.00 | 2025-08-04 | 24800.00 | 73.00 | 0.30% | end_of_day |
| 2025-08-07 | 24615.10 | 2025-08-07 | 24710.00 | 94.90 | 0.39% | end_of_day |
| 2025-08-11 | 24499.00 | 2025-08-11 | 24633.70 | 134.70 | 0.55% | target_hit |
| 2025-08-20 | 25006.80 | 2025-08-20 | 25077.00 | 70.20 | 0.28% | target_hit |
| 2025-09-03 | 24711.80 | 2025-09-03 | 24821.75 | 109.95 | 0.45% | target_hit |
| 2025-10-16 | 25529.00 | 2025-10-16 | 25632.50 | 103.50 | 0.41% | target_hit |
Highest absolute return: 2.88%. Eleven trades hit the 1.5R target. No trailing complexity. Average R per trade is highest of all variants: 0.28. Cleanest exit profile: 21 day-end closes, 11 targets hit, 10 stops hit. Same win rate as Variant 1 (57.1%), but double the average R per winner.
Why Fixed Targets Won
Fixed 1.5R target was achievable. Eleven out of 42 trades reached it. Twenty-one closed at day’s end. Ten stopped out.
Clean mechanics. No trailing stop getting reset by ATR calculations. No RSI filter exiting winners too early.
When each winning trade generates more R on average, fewer total wins are needed to compound money.
Variant 1 (trailing): 57% wins at 0.16R = 1.09% return.
Variant 4 (fixed): 57% wins at 0.28R = 2.88% return.
Same win rate. Different outcome. Stop/target design changed everything.
Why ATR Stops Failed
Unlike the 20 and 50 SMA strategy, where the ATR method had 50% but greater return on investment on daily timeframe, this ORB strategy performed on 5 min data failed to return greater returns. Nineteen hard stops out of 42 entries. ATR volatility math placed stops in the noise zone.
Opening-range low is where price actually tested supply/demand. ATR is recent price fluctuation. They serve different purposes. For opening-range breakouts, structural support was more reliable.
Why RSI Worked But Didn’t Win
71.4% win rate is exceptional. Only 12 losses across 42 trades.
But overbought exits forced position closure before 2R was reachable. Twenty-seven trades exited on RSI≥70 signal.
The strategy traded certainty (exit at exhaustion) for speed (81 minute average hold).
The math works. Higher win rate at lower R can outperform lower win rate at higher R over enough sample size. But only when the numbers align right.
Exit Distribution by Variant
| Variant | EOD Flat | Stop Hit | Target Hit | Trail/Other | Total |
| OR Low + ATR Trail | 18 | 10 | 2 | 12 | 42 |
| ATR(14) Stop | 0 | 19 | 5 | 18 | 42 |
| RSI ≥70 Exit | 5 | 6 | 1 | 30 | 42 |
| Fixed 1.5R Cap | 21 | 10 | 11 | 0 | 42 |
Variant 1: Balanced exits. Eighteen day-end closes with modest profits. Two targets hit. Trailing mechanism created multiple exit events.
Variant 2: Nineteen hard stops (45% of all trades). Zero day-end closes. ATR volatility math placed stops in noise zone. Immediate bleeding prevented any runway.
Variant 3: Twenty-seven RSI exits from overbought condition. Dominated exit behavior. Only one target hit. High win rate from early exits before larger moves could develop.
Variant 4: Eleven targets hit (26% of all trades). Twenty-one day-end closes (50%). Only ten stops. Cleanest exit profile. No complexity. Predictable mechanics.
What Matters
Average R per trade matters more than win rate.
0.28R average beats 0.18R average. Even with lower win rate.
Stop placement determined R per trade. OR-low stop: 0.16-0.28R average. ATR stop: 0.02R average. RSI filter: 0.18R average.
How We Tested This
Data and Period: Nifty 50 futures. July 28 through October 31, 2025. 5-minute candles. Trading hours 9:15 AM to 3:25 PM IST. No overnight risk.
Entry Signals: Identical across all variants. Opening-range breakout above the high of the first 30 minutes. 42 signals total. Entry fills at next bar’s open.
Exit Mechanics: Check in order: gap opens first, then intraday levels, then optional filters (RSI/trailing), then close at 3:25 PM.
Assumptions: All testing assumed zero costs. Real trading subtracts 1-2 points slippage per entry/exit plus minimal commission. These reduce returns by approximately 10-15%.
Position Sizing: Fixed one unit per entry throughout all variants. No compounding. No size scaling. Same rupee amount per trade.
Variant Comparison: Quick Reference
| Priority | Best Variant | Win Rate | Return | Key Metric |
| Maximum Profit | Variant 4: Fixed 1.5R Cap | 57.1% | +2.88% | 0.28R average per trade |
| Highest Win Rate | Variant 3: RSI ≥70 Exit | 71.4% | +1.54% | Only 12 losses in 42 |
| Balance | Variant 1: OR Low + ATR Trail | 57.1% | +1.09% | Structural support stop |
| Avoid | Variant 2: ATR(14) Stop | 50.0% | -0.16% | 45% immediate stops |
Implementation
Use Variant 4 if maximizing returns: Fixed 1.5R, no trailing. 2.88% return. Simplest mechanics. Highest average R per trade.
Use Variant 3 for consistency: RSI exit at overbought. 71.4% win rate. 1.54% return. More frequent small wins.
Use Variant 1 for balance: OR low stop with ATR trailing. 1.09% return. Moderate wins, structural support.
Avoid Variant 2 on opening-range breakouts. ATR stops destroy edge here. Use ATR only when lacking structural support.
Size positions so maximum loss is 1% of account per trade. This ensures sustainability through inevitable losing streaks.
Paper trade for two weeks. Track every signal. Understand psychology. Then commit real capital only if you can follow rules without second-guessing.
Bottom Line
One trade per session, opening-range breakout, fixed 1.5R target. 42 signals over four months. 2.88% compounded return. 57% win rate.
Stop placement determined edge. Average R per trade determined profitability.
Fixed targets beat trailing stops in this regime. Simple mechanics outperformed complex trailing mechanisms.
The strategy works. The question is whether you can execute it without second-guessing.
It will be foolish to consider these past results as a guarantee for future performance. No strategy works everytime. Check what works for you, plan your trades carefully.
Share this insight
Spread the Alpha
Related Articles
More ideas that align with your trading playbook.

Testing the 20/50 SMA Crossover Algo Strategy on Nifty 50
When you first learn about moving average crossovers, the concept seems almost too simple. Two lines on a chart. They cross. You…


Send bullish stock