Penny stock – NCL Reseach will Grow by 5x in coming days!
Welcome once again to an article where we will talk about a penny stock under ₹1 that will triple its value in coming years. The company we are talking about is Ncl Research & Financial Services (BSE: NCLRESE). NCL Research comes under the category of an NBFC (Non-Banking Financial Company)
As we know, the business and startup culture in India is growing faster than ever. More and more companies are getting listed on the Indian stock market each week. Companies generally get listed on stock exchanges like NSE and BSE to raise capital for expansions and further growth. But, smaller companies can not get listed on the stock exchange or issue bonds to raise money. This is where companies like NCL Research come into the picture. If you like investing in penny stocks you can check list of Top 5 Penny Stocks for 2023. Let us now discuss in detail what NCL Research does.
About NCL Research (NCLRESE)
The company N.C.L. Research & Financial Services Ltd. was founded on February 4, 1985. Originally they traded textiles products, but now their main business is finance and investing in stocks and securities. The current share price of NCL Research is Rs. 0.59 which is well below Rs. 1.
They are registered with the Reserve Bank of India as a non-banking financial company (NBFC). So they provide business financing and make investments in addition to their traditional textile trading business.
NCL Research Financials
NCL Research Quarterly Results analysis
First, let’s look at the quarterly results.
- Operating Revenue: It has increased from 0.47 Cr in Jun 2022 to 1.08 Cr in Jun 2023, which is a good sign as it shows the company is generating more revenue.
- Operating Expenses: These have fluctuated over the periods, but there is a significant decrease from 1.12 Cr in Jun 2022 to 0.37 Cr in Jun 2023. This decrease in operating expenses is positive as it indicates the company is controlling its costs.
- Profit Before Tax (PBT): It has moved from a loss of -0.77 Cr in Jun 2022 to a profit of 0.65 Cr in Jun 2023. This is a positive sign as the company has managed to turn around its operations from a loss to a profit.
- Net Profit: This is the profit remaining after paying taxes. It has also moved from a loss of -0.77 Cr in Jun 2022 to a profit of 0.49 Cr in Jun 2023. This is also a positive sign as it indicates the company is now profitable.
NCL Research Profit & Loss analysis
- Operating Income: This has increased from 3.40 Cr in Mar 2019 to 3.76 Cr in Mar 2023, which is a positive sign as it shows the company is generating more income.
- Operating Expenses: These have increased from 3.23 Cr in Mar 2019 to 2.99 Cr in Mar 2023. Although the expenses have increased, it is less than the increase in operating income, which is a positive sign.
- Profit Before Tax (PBT): It has increased from 0.16 Cr in Mar 2019 to 0.80 Cr in Mar 2023. This is a positive sign as it indicates the company is generating more profits before tax.
- Profit After Tax (PAT): This is the profit remaining after paying taxes. It has increased from 0.11 Cr in Mar 2019 to 0.60 Cr in Mar 2023. This is also a positive sign as it indicates the company is now more profitable.
Balance Sheet analysis of NCL Research
- Share Capital: This has increased significantly from 29.09 Cr in Mar 2019 to 107.03 Cr in Mar 2023. This indicates that the company has issued more shares to raise capital.
- Total Reserves: These have decreased from 32.77 Cr in Mar 2019 to 17.08 Cr in Mar 2023. This is a concern as it indicates the company has used its reserves.
- Current Liabilities: These have increased slightly from 1.79 Cr in Mar 2019 to 2.34 Cr in Mar 2023. This is not a major concern as the increase is not significant.
- Current Assets: These have more than doubled from 63.63 Cr in Mar 2019 to 130.24 Cr in Mar 2023. This is a positive sign as it indicates the company has more assets to cover its liabilities.
Short Term Outlook for NCL Research
In the short term, the company seems to be in a good position. It has turned around its operations from a loss to a profit, and its operating revenue has increased while controlling its operating expenses. The company has also increased its operating income while keeping the operating expenses under control. However, the company has used its reserves, which is a concern.
Medium Term Outlook for NCL Research
In the medium term, the company has significantly increased its share capital, which indicates it has raised more capital. This is a positive sign as it indicates the company has more resources to invest in its operations and growth. However, the decrease in total reserves is a concern as it indicates the company has used its reserves. The company needs to focus on generating more profits to replenish its reserves.
Long Term Outlook for NCL Research
In the long term, the company has significantly increased its current assets, which is a positive sign as it indicates the company has more assets to cover its liabilities. However, the company needs to focus on generating more profits to increase its reserves and strengthen its balance sheet.
Future of NCL Research
Based on the financial data, the company seems to be in a good position in the short term as it has turned around its operations from a loss to a profit and has increased its operating revenue and income while controlling its expenses. However, the company needs to focus on generating more profits to replenish its reserves and strengthen its balance sheet in the medium to long term.
The company has significantly increased its share capital and current assets, which indicates it has more resources to invest in its operations and growth. However, the company needs to be cautious about using its reserves and focus on generating more profits.
Overall, the company seems to be on the right track, but it needs to focus on generating more profits and strengthening its balance sheet to ensure its long-term success.
Technical analysis of NCL Research
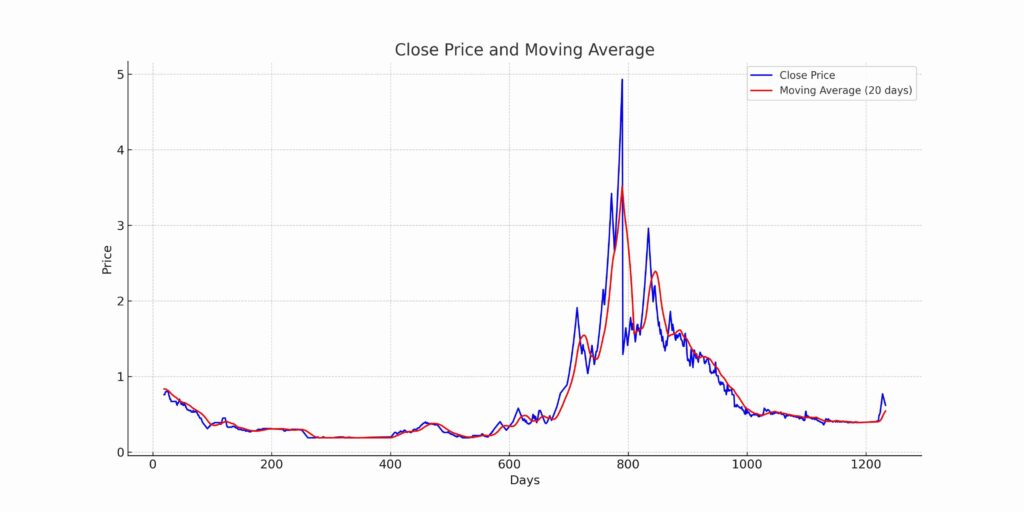
Moving average chart
The first plot shows the Close Price and the Moving Average (20 days). The Moving Average smoothens the price data to create a single flowing line, which makes it easier to identify the direction of the trend.
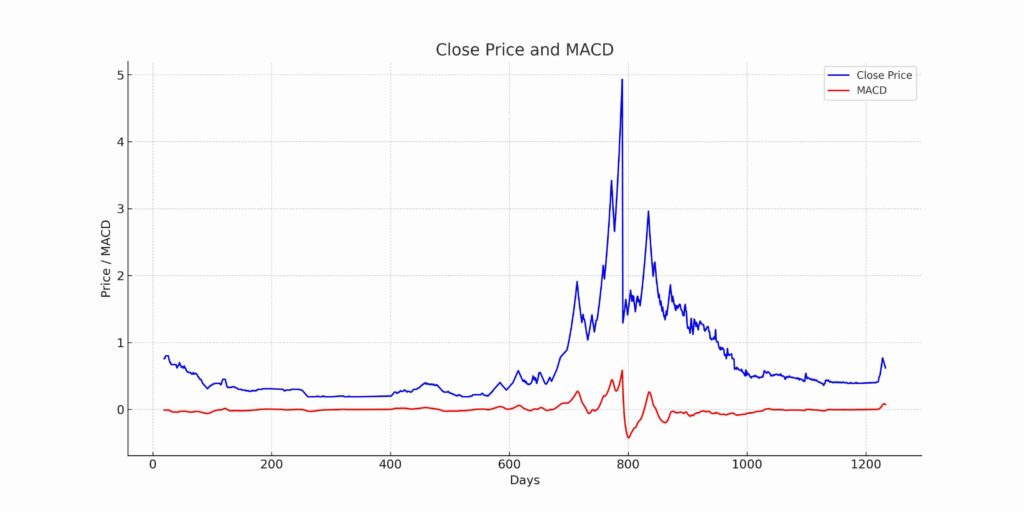
MACD Chart of NCL Research
The below chart shows the Moving Average Convergence Divergence (MACD). The MACD is a trend-following momentum indicator that shows the relationship between two moving averages of a security’s price. The MACD is calculated by subtracting the 26-day EMA from the 12-day EMA.
RSI chart of NCL Research
The chart below shows the Relative Strength Index (RSI). The RSI oscillates between zero and 100. Traditionally, and according to Wilder, RSI is considered overbought when above 70 and oversold when below 30. The plot includes horizontal lines at 30, 70, and the shaded region between 30 and 70.

NCL Price prediction using Technical Indicators
| Indicator | Current Value | Indication |
|---|---|---|
| Moving Average (20 days) | 0.54 | Bullish |
| Relative Strength Index (RSI) | 70.59 | Overbought |
| Moving Average Convergence Divergence (MACD) | 0.073 | Bullish |
| Predicted Close Price (Random Forest) | 0.621 | Bullish |
| Predicted Close Price (Gradient Boosting) | 0.626 | Bullish |
| Simple Moving Average (50 days) | 0.454 | Bullish |
| Exponential Moving Average (20 days) | 0.576 | Bullish |
| Bollinger Bands (Upper) | 0.813 | Neutral |
| Bollinger Bands (Lower) | 0.272 | Neutral |
| Average True Range (14 days) | 0.034 | High Volatility |
| Stochastic Oscillator (14 days) | 55 | Neutral |
Final Thoughts about NCL Research
NCL Research has improved its financials over time. The stock has experienced a long period of consolidation and its finally broken its previous range. In coming time, we can see price appreciation of about 2 to 5 times in NCL Research.
About the author
Pranay
Senior Researcher and Editor
Pranay is the co-founder of DailyBulls.in, a trader-focused market research and learning platform, and OIHelper.com, a platform focused on open interest analysis. He has 5+ years of experience following Indian markets, with core interests in technical analysis, stock screeners, open interest analysis, and structured research workflows.He is also a coder and spends much of his time building custom stock screeners, research tools, and AI-assisted workflows that help organize market data, improve research efficiency, and make technical learning more practical for traders and market learners. Through DailyBulls.in, he shares educational content, research-driven articles, and workflow ideas built around technical analysis, market behavior, and data-backed learning.His work has also been referenced in academic publishing, including an MDPI-published paper in the Journal of Risk and Financial Management.
Share this insight
Spread the Alpha
If this analysis helped you, pass it along to your trading desk or community.
Related Articles
More ideas that align with your trading playbook.
Jana Small Finance Bank (JSFB) Share Price Target 2026, 2027 upto 2030
Tanla Platforms Ltd (NSE:TANLA) Share Price Target 2024, 2025, 2026, 2027, 2028 upto 2030 with detailed technical analysis report
RVNL Future Analysis 2026, 2027 upto 2030
Data Patterns (India) Ltd (NSE:DATAPATTNS) Share Price Target 2024, 2025, 2026, 2027, 2028 upto 2030 with detailed technical analysis report
Data Patterns (India) Ltd (DATAPATTNS) Share Price Target 2026, 2027 upto 2030
Data Patterns (India) Ltd (NSE:DATAPATTNS) Share Price Target 2024, 2025, 2026, 2027, 2028 upto 2030 with detailed technical analysis report
 DailyBulls (Arthashilpi Ventures) is a D-U-N-S verified company.