
This metal stock is all set for a New All Time High
Hello, once again, traders and investors! In the previous post, we talked about a company from the Metal sector that rose above 55% in just 3 months! In this article, we will discuss another stock from the metal industry that is on the verge of making a new all time high!
The company we will talk about is India’s third largest private steel producer. Not only this, but the company is the only private company in India that produces Rails. The company operates large steel plants and has a presence across India. It makes products like plates, pipes and beams that are used in construction, infrastructure projects, automobile manufacturing and other industries. It also exports its steel products across the globe.
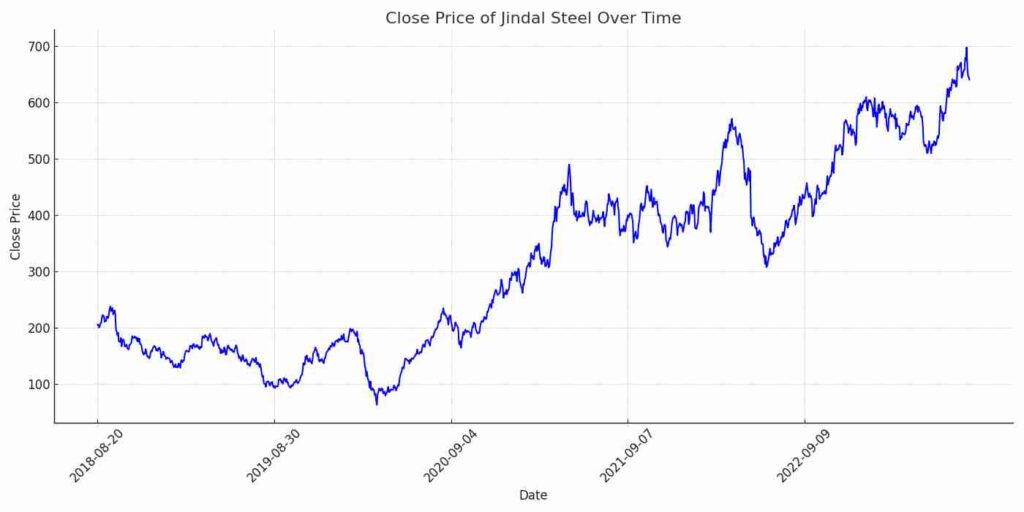
The company that we are talking about is from Jindal Group. You guess it right! The company we are discussing is Jindal Steel and Power Limited (JSPL). Even though it may not be a household name, JSPL is an important steel company in India. It is the third largest private steel producer in the country, which means it has substantial production capacity and market share.
Jindal Steel and Power Limited (NSE:JINDALSTEL)
What makes JSPL stand out is that it is the only private company in India that manufactures steel rails for the railway network. Rail production has traditionally been dominated by state-owned companies in India. So JSPL has broken new ground by being a private rail manufacturer. By being one of the largest private steel companies in India and the only private rail producer, JSPL has established itself as an important industrial company.
It has contributed to India’s steel production capacity and also created jobs through its operations. The fact that a private company like JSPL can manufacture rails competitively is a positive sign for industry liberalization in India.
Jindal Steel and Power Financials
| PARTICULARS | JUN 2022 | SEP 2022 | DEC 2022 | MAR 2023 | JUN 2023 |
|---|---|---|---|---|---|
| Net Sales | 12,848.52 | 13,107.06 | 11,832.25 | 13,392.25 | 12,310.57 |
| Total Expenditure | 9,537.70 | 11,269.35 | 9,587.78 | 11,252.09 | 9,657.24 |
| Operating Profit | 3,310.82 | 1,837.71 | 2,244.47 | 2,140.16 | 2,653.33 |
| Other Income | 20.83 | 8.08 | 9.66 | 10.34 | 14 |
| Interest | 257.93 | 319.77 | 343.46 | 364.62 | 257.86 |
| Depreciation | 539.53 | 544.46 | 544.32 | 537.63 | 539.89 |
| Exceptional Items | 5,804.69 | -1,663.93 | -7,252.60 | -146.42 | 0 |
| Profit Before Tax | 8,338.88 | -682.37 | -5,886.25 | 1,101.83 | 1,869.58 |
| Tax | 1,715.80 | -209.20 | -1,373.98 | 312.63 | 470.06 |
| Profit After Tax | 6,623.08 | -473.17 | -4,512.27 | 789.20 | 1,399.52 |
| Adjusted EPS (Rs) | 65.90 | -4.71 | -44.90 | 7.85 | 13.93 |
Jindal Steel Quarterly Results
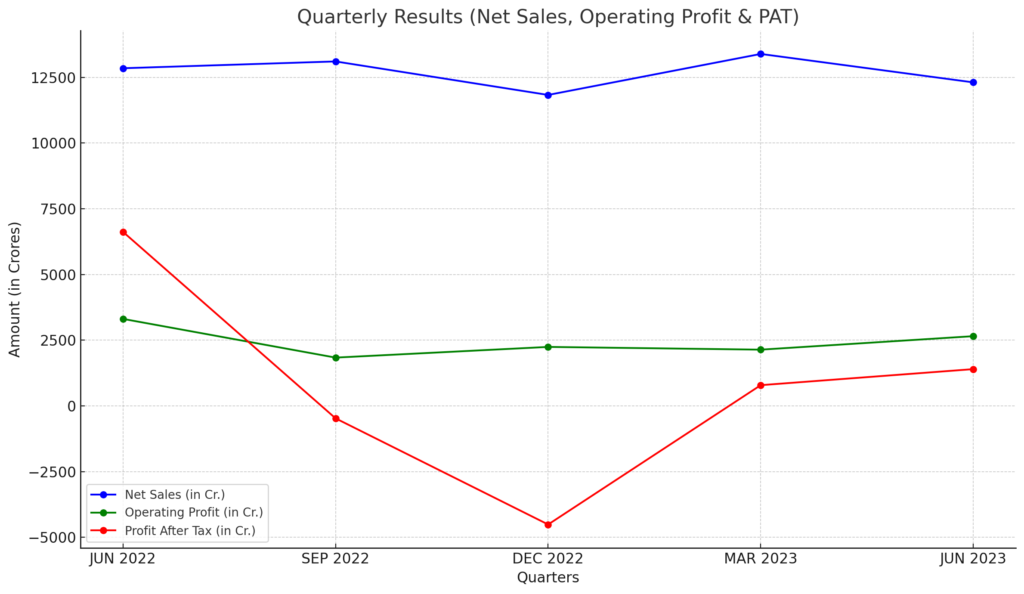
- Net Sales: There are fluctuations in net sales across the quarters, with a noticeable dip in December 2022.
- Operating Profit: This metric sees a significant dip in September 2022 and then slowly recovers, indicating that while the company’s revenue was somewhat consistent, its expenses likely varied.
- Profit After Tax (PAT): PAT turned negative in September and December 2022, which means the company had losses during these periods. The reason for this is probably the exceptional items, which are unusually high negative values in these quarters.
Jindal Steel's Yearly Profit & Loss
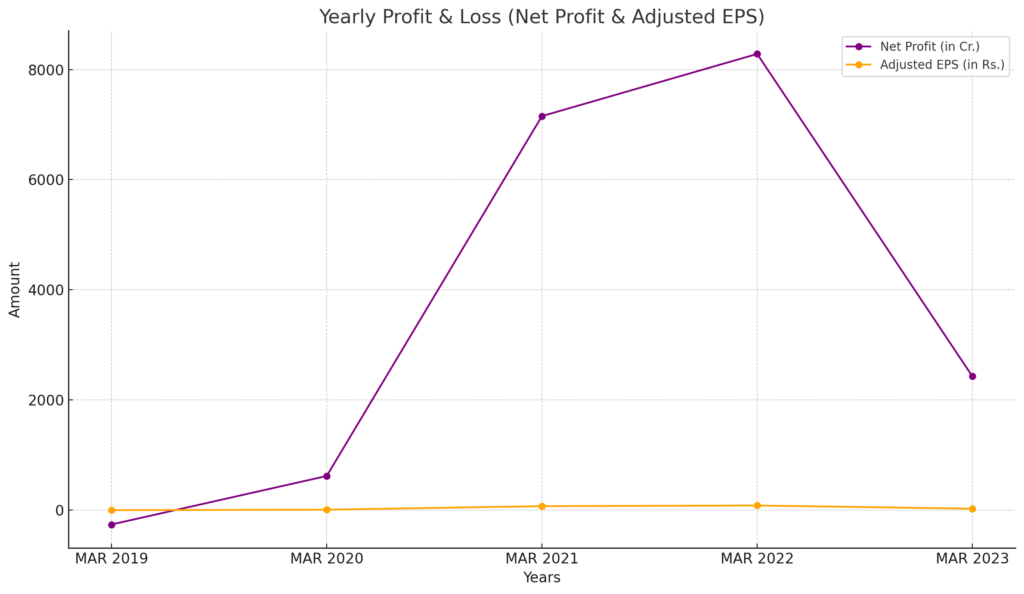
- Net Profit: We observe a significant leap in net profit from March 2020 to March 2021. The profit continued its upward trajectory till March 2022. However, there’s a notable drop in net profit by March 2023.
- Adjusted EPS: The EPS trend aligns with the net profit trend. It saw a sharp rise between 2020 and 2022 but faced a decline by 2023.
Short-term Performance (Quarterly Results)
On Jindal Steel’s quarterly performance recently – it’s been a bit rough. In the last half of 2022, their sales dropped and they recorded losses. Things improved slightly by June 2023, but there are still worrying signs in the results.
Long-term Performance (Yearly P&L)
On Jindal Steel’s quarterly performance recently – it’s been a bit rough. In the last half of 2022, their sales dropped and they recorded losses. Things improved slightly by June 2023, but there are still worrying signs in the results.
Financial Position (Balance Sheet)
In terms of their financial health, the good news is that Jindal Steel has been steadily building up their reserves and cash resources over time. This provides a cushion for difficult periods. On the borrowings front, while debt peaked in 2021, it has since been reducing. So they seem less reliant on loans now than before.
Summary of Jindal Steel and Power Financial Performance
Overall, while Jindal Steel showed great growth previously, 2023 has shaped up as a challenging period. There could be many reasons for this – market conditions, internal issues, or exceptional charges. The metal sector is affected by import and export policies and the Dollar index. For investors or other stakeholders, it would be important to further analyze why 2023 has panned out this way for Jindal Steel. But the past track record shows the company has the ability to deliver results.
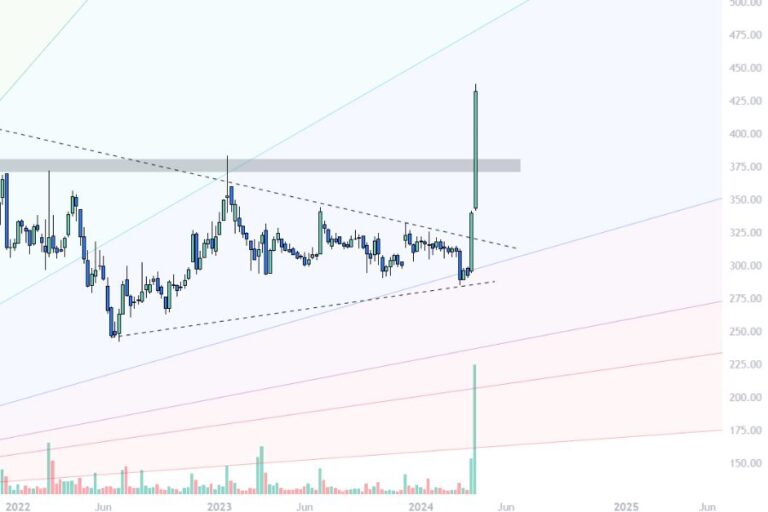
Jindal Steel and Power Technicals
Moving Averages analysis of Jindal Steel and Power
We’ll use a short-term moving average (50 days) and a long-term moving average (200 days) to detect potential trends and crossover points. Crossovers of these averages often indicate potential buy or sell signals.
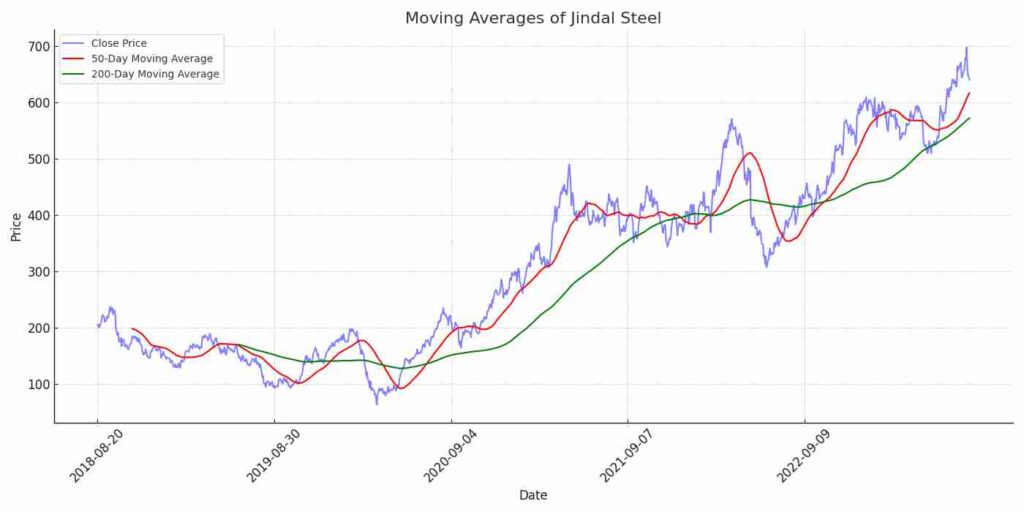
Key Observations:
- Golden Cross: Around mid-2020, the 50-day moving average crosses above the 200-day moving average. This is a bullish signal known as a “Golden Cross”, indicating a potential long-term uptrend.
- Consistent Gap: Post the Golden Cross, the 50-day moving average remains consistently above the 200-day moving average, indicating sustained upward momentum.
- Potential Support: The 200-day moving average seems to act as a support level, especially noticeable in late 2020 and early 2022 when the price briefly touches or approaches the green line before bouncing back.
Jindal Steel and Power analysis using RSI
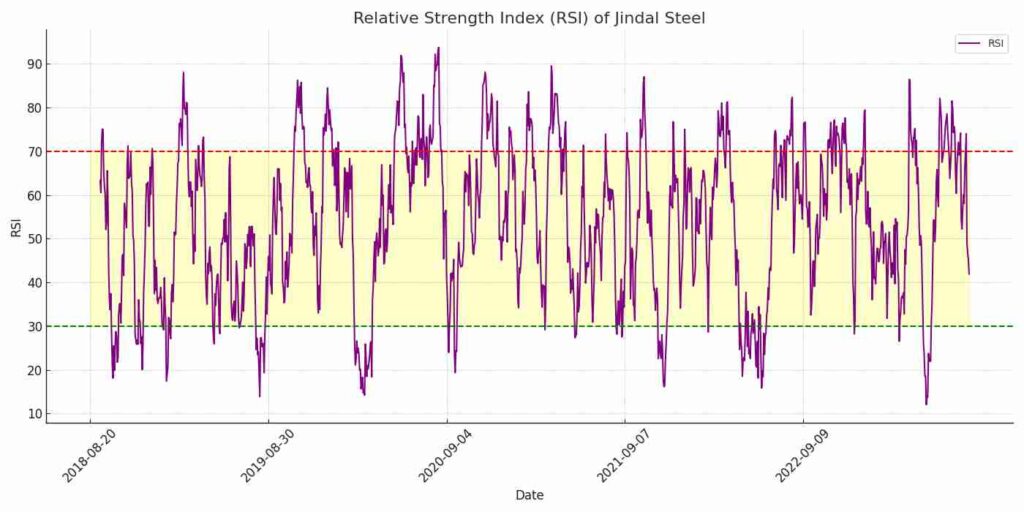
Key Observations:
- Oversold Zones: There are instances, notably around early 2020 and mid-2021, where the RSI dipped below 30. This is an indication that the stock might have been oversold, and a price rebound could be expected.
- Overbought Zones: We also observe periods, especially around late 2020, where the RSI crossed above 70, indicating potential overbought conditions. This could signal that a corrective price movement might follow.
- Current RSI: The latest RSI value is approximately 41.92. A value of 41.92, which is in the neutral zone. This suggests that the stock is neither in an overbought nor in an oversold condition currently.
Jindal Steel and Power analysis using MACD

Key Observations:
- Crossovers: Buy or bullish signals are generated when the MACD line crosses above the Signal line, and sell or bearish signals are generated when the MACD line crosses below the Signal line.
- Divergence: When the stock price diverges from the MACD, it can signal the end of the current trend. For instance, if the stock price is rising but the MACD is dropping, this might indicate a potential trend reversal.
- Current Values: The current MACD value is approximately 9.78 and the Signal line value is 14.95. Since the MACD line is below the Signal line, this might be seen as a bearish signal by some traders.
Jindal Steel Ai Price forecast for long term
Using advanced modelling trained on historical data we have predicted price for Jindal Steel below. You can also get daily share price targets for Jindal Steel – Jindal Steel share price target for tomorrow.
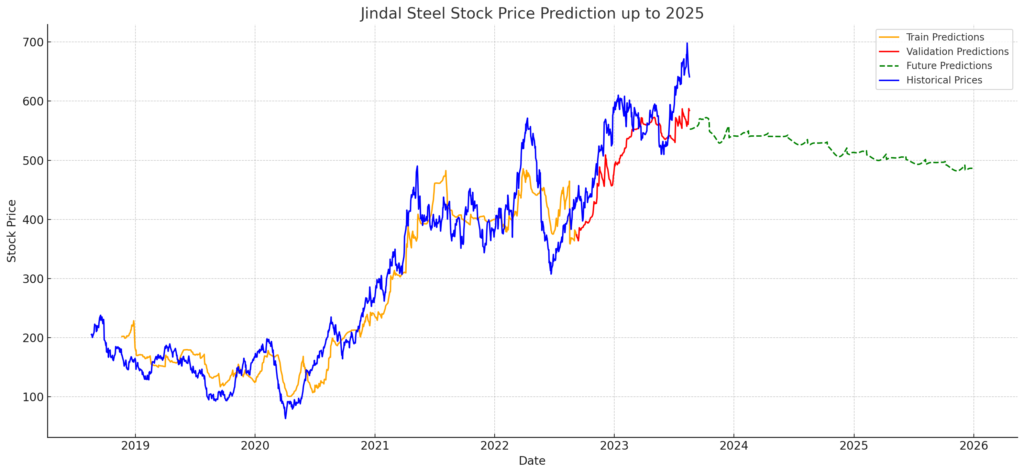
Note- This is Ai prediction and may not be accurate. Stock prices are influenced by company’s performance, macro and micro economic factors.
Final Words
While the metal sector is on Boom due to Dollar depreciation, it is important to study technicals and make entries at key support zones. Jindal Steel is a promising company that has witnessed steady growth. However, always consult your financial advisor before making any investment decisions. That’s it for this post. See you in the next one. Happy investing!
About the author
Pranay
Senior Researcher and Editor
Pranay is the co-founder of DailyBulls.in, a trader-focused market research and learning platform, and OIHelper.com, a platform focused on open interest analysis. He has 5+ years of experience following Indian markets, with core interests in technical analysis, stock screeners, open interest analysis, and structured research workflows.He is also a coder and spends much of his time building custom stock screeners, research tools, and AI-assisted workflows that help organize market data, improve research efficiency, and make technical learning more practical for traders and market learners. Through DailyBulls.in, he shares educational content, research-driven articles, and workflow ideas built around technical analysis, market behavior, and data-backed learning.His work has also been referenced in academic publishing, including an MDPI-published paper in the Journal of Risk and Financial Management.
Share this insight
Spread the Alpha
If this analysis helped you, pass it along to your trading desk or community.
Related Articles
More ideas that align with your trading playbook.
Amber Enterprises (BSE: 540902): Bullish Flag Pattern— Is the Upward Momentum Set to Continue?
Amber Enterprises (NSE:AMBER) (BSE:540902) is a small cap stock with MCAP of 15,364 crores and operates in the consumer durable sector. The…
Breakout stock for Swing Trade – Garware Technical Fibres (NSE:GARFIBRES)
Garware Technical Fibres Ltd. (NSE:GARFIBRES) (BSE:509557) works in the textile domain and is a leading manufacturer of technical fibres like fishing and…
Hindustan zinc rises before earning concall, Should you hold?
Hindustan Zinc which is listed on NSE under ticket (NSE:HINDZINC) marked a new all time high on April 12, 2024. The stock…
 DailyBulls (Arthashilpi Ventures) is a D-U-N-S verified company.


Your writing style is so engaging and easy to follow I find myself reading through each post without even realizing I’ve reached the end