Dailybulls

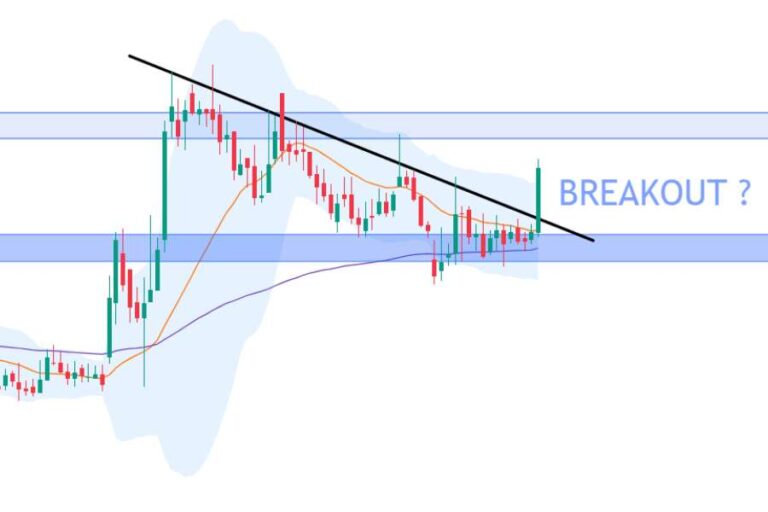
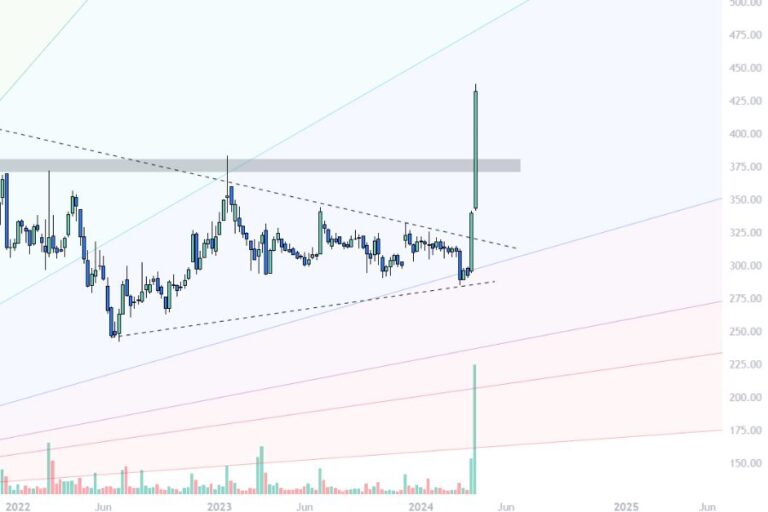
Amber Enterprises (BSE: 540902): Bullish Flag Pattern— Is the Upward Momentum Set to Continue?

NSE:AMBER

Amber Enterprises (NSE:AMBER) (BSE:540902) is a small cap stock with MCAP of 15,364 crores and operates in the consumer durable sector. The company manufactures heating, motors and ventilation equipment which are used in Air conditions.

Share price of Amber closed 4.05% higher today (29 August) at ₹4556.80 and is now trading near an all time high zone. The stock has outperformed flagship index Nifty in both one week and month. 

PeriodAMBER's ReturnsNifty's Returns
Daily4.05%0.40%
Weekly9.02%1.54%
Monthly4.81%1.19%

The stock is up nearly 75% from its 52 week low of ₹ 4,880. Fundamentally, the stock is on higher side of valuation, with weak financials and negative profit growth. However, technical data shows another picuture. The stock can generate 7 to 10 percent of returns* for traders in short to medium terms. 

Amber Enterprises 52 Week Price Range

As of 29 Aug 2024
52 Week Low ₹2,712.10
Current Price ₹4,590
52 Week High ₹4,880

Technical Chart of Amber

Amber, with the formation of a Bullish Flag pattern has broken from the resistance, supported by increased volume. Shares of this company is now heading towards previous resistance zone of 4600. 

bullish flag pattern in amber enterprices
Technical chart of NSE:AMBER showing bullish pattern breakout

The chart also shows a key support level at 4000, which could provide stability in case of any retracements. Given the recent bullish trend and the break above critical resistance, investors might expect Amber to maintain its upward trajectory if it consistently holds above these newly established support zones.

This support also happens to be near 50% fibonacci level. In an uptrend, when a stock retraces upto 50% fib, and continues further upward momentum, it’s a sign of a healthy up trend.

How to trade Amber for swing?

  • Entry 1 – Entering long (buying) at current price of 4560 with Target of 4930 and stop loss of 4330. This approach which aggressive traders follow, involves entering the stock without waiting for a retracement, is riskier but can prevent missing out on potential momentum.
  • Entry 2 – Buy Amber Enterprises near 4400 on retracement, with stop loss of 4150 and target of 4750. This is safer but investors can miss out on move if the stock does not retrace. 
Brokrage firm Sharekhan has given a target of ₹5010, and the aggregated target for Amber Enterprises from multiple reseach firms is ₹4750. 

Technical Strengths

  • Amber is making Higher Highs from last 3 days
  • Stock above upper Bollinger band
  • RSI showing strength
  • Formation of White Marubozu Candle

While the stock holds potential for some upside in short term, its financials are underperforming. Long term investors should keep tracing improvements in the company’s fundamentals. 

*Returns – mentioned are hypothetical and do not guarantee actual gains, as they are based on potential outcomes derived from technical analysis. Traders are encouraged to learn how to use technical tools for making informed entry and exit decisions, rather than relying solely on the information provided. The entries mentioned are for informational purposes only and do not constitute financial advice.

5/5 - (1 vote)

Disclaimer: Stock targets and forecasts are for educational purposes only and may not be reliable for investment decisions. Use this information at your own risk. This is not an offer to buy or sell stocks. Dailybulls.in and its authors are not liable for any losses. It is not investment advice; seek professional advice before making any investment decisions. Exercise caution and be informed when investing.

WhatsApp Join Free Group!

Leave a Comment