Aditya Birla Capital Ltd. (ABCAPITAL) Price targets and intraday forecasts for tomorrow
Updated 15 June 2026 · NSE: ABCAPITAL · Currency: INR
Aditya Birla Capital Ltd.
NSE: ABCAPITAL
Sector: Loading... · Loading...
Quick snapshot to frame ABCAPITAL's target tomorrow before drilling into the pivot levels and intraday range.
ABCAPITAL Today's Performance
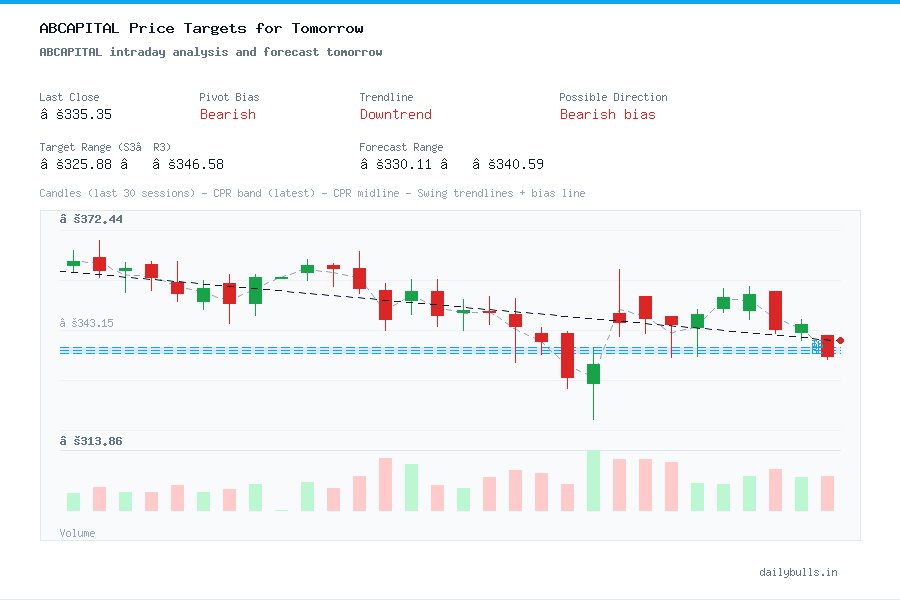
ABCAPITAL opened today at ₹365.40 and marked a high of ₹374.50. The low price was ₹365.40 and the stock finally closed at ₹366.55. This data is crucial to forecast ABCAPITAL's targets for tomorrow's day trading session. Learn more
Today, shares of Aditya Birla Capital Ltd. closed above previous closing, which is evident from the formation of Higher High. In the coming days, the stock may continue to rise, suggesting a bullish forecast.
Strength Matrix graph shows how ABCAPITAL might perform tomorrow by highlighting its price strength, momentum, volatility, and trend direction. Tracking these short-term trends daily can help better understand changes in the market.
Strength Matrix
Technical overview of how the stock may perform in the upcoming session.
Technical Strength and Weaknesses
Understanding strengths and weaknesses in technical indicators is important as these points will help to decide whether or not to trade ABCAPITAL tomorrow.
Strengths
- RSI shows moderate strength, indicative of likely continued upward momentum.
- The price is above the SMA, suggesting moderate bullish signals. The market shows a consistent trend above the SMA, though vigilance is needed as market conditions could change.
- Mildly bullish signals for tomorrow.
- SAR points to slight bullish signals, with potential for mild upward movement.
- SAR signals a potential bullish reversal, possible upward movement.
Potential Weaknesses
- ADX indicates strong bearish movements are likely.
Similar Stocks like Aditya Birla Capital Ltd.
ABCAPITAL target tomorrow — summary
ABCAPITAL's target tomorrow is anchored around pivot levels, with R1–R3 defining potential upside and S1–S3 outlining the downside map for intraday traders.
If price opens above the pivot and sustains strength, upside targets are more likely to be tested. If it opens below and fails to reclaim the pivot, downside supports become the focus.
- • Primary intraday range: S3 → R3
- • Near-term reaction zones: S1/S2 and R1/R2
- • Use pivot bias to frame the first 60–90 minutes of trade
ABCAPITAL last 5 day range
Reviewing the last five sessions helps interpret how ABCAPITAL's target tomorrow may behave. Tight ranges often precede expansion, while wide ranges may signal consolidation before the next move.
| Date | High | Low | Close |
|---|---|---|---|
| 2 June 2026 | ₹352.50 | ₹344.00 | ₹351.20 |
| 3 June 2026 | ₹350.95 | ₹342.00 | ₹349.00 |
| 9 June 2026 | ₹352.45 | ₹345.40 | ₹352.00 |
| 12 June 2026 | ₹359.25 | ₹343.55 | ₹357.35 |
| 15 June 2026 | ₹374.50 | ₹365.40 | ₹366.55 |
• Range compression suggests a potential breakout window.
• Higher highs and higher lows indicate bullish momentum; lower highs point to supply pressure.
• Volume spikes near highs/lows increase the importance of those levels tomorrow.
ABCAPITAL target tomorrow using standard pivot points
Tomorrow, using standard pivots, the target range for ABCAPITAL sits between R3 and S3, marking the key resistance and support zones to watch intraday.
These classic pivot targets help traders frame likely price movement and identify possible breakout or reversal areas for ABCAPITAL.
| Target Type | Level | Price |
|---|---|---|
| Up Target 1 | R1 | ₹372.23 |
| Up Target 2 | R2 | ₹377.92 |
| Up Target 3 | R3 | ₹381.33 |
| Down Target 1 | S1 | ₹363.13 |
| Down Target 2 | S2 | ₹359.72 |
| Down Target 3 | S3 | ₹354.03 |
ABCAPITAL target tomorrow using Fibonacci pivot points
Tomorrow’s Fibonacci pivot targets outline a measured range for ABCAPITAL between S3 and R3, highlighting where momentum may pause or accelerate.
The Fib levels (R1–R3 and S1–S3) are helpful for intraday entries, exits, and stop planning for ABCAPITAL.
| Target Type | Level | Price |
|---|---|---|
| Up Target 1 | R1 | ₹372.29 |
| Up Target 2 | R2 | ₹374.44 |
| Up Target 3 | R3 | ₹377.92 |
| Down Target 1 | S1 | ₹365.34 |
| Down Target 2 | S2 | ₹363.19 |
| Down Target 3 | S3 | ₹359.72 |
ABCAPITAL target tomorrow using Camarilla pivot points
Camarilla pivots focus on tighter intraday bands; for ABCAPITAL tomorrow, R3–R4 and S3–S4 represent the key reaction zones.
Traders often use these levels to anticipate quick mean‑reversion moves and short‑term breakouts in ABCAPITAL.
| Target Type | Level | Price |
|---|---|---|
| Up Target 1 | R1 | ₹367.38 |
| Up Target 2 | R2 | ₹368.22 |
| Up Target 3 | R3 | ₹369.05 |
| Down Target 1 | S1 | ₹365.72 |
| Down Target 2 | S2 | ₹364.88 |
| Down Target 3 | S3 | ₹364.05 |
ABCAPITAL target tomorrow — risk/reward snapshot
A simple risk/reward framework keeps ABCAPITAL's target tomorrow actionable without over‑trading. This is not a signal — it’s a planning template built around pivots.
Use the pivot as the decision line, define risk beyond S1/R1, and scale targets toward R1/R2 (for long bias) or S1/S2 (for short bias).
| Scenario | Entry | Stop | Targets |
|---|---|---|---|
| Bullish bias | Near Pivot | Below S1 | R1 → R2 |
| Bearish bias | Near Pivot | Above R1 | S1 → S2 |
ABCAPITAL target tomorrow — intraday checklist
Before acting on ABCAPITAL's target tomorrow, run a short checklist to reduce noise and confirm momentum.
- • Is price opening above or below the pivot?
- • Is early volume above the 20‑day average?
- • Did price break the first 15‑minute range with follow‑through?
- • Are S1/S2 or R1/R2 being respected on retests?
- • Does the intraday direction align with weekly bias?
- • Avoid trades if price chops around the pivot.
ABCAPITAL target tomorrow — daily vs weekly bias
The daily bias captures immediate momentum, while the weekly pivot provides broader context for ABCAPITAL's target tomorrow.
When both biases align, target levels have higher probability. When they diverge, expect mixed price action and quicker profit‑taking.
- • Daily bias: Bullish
- • Weekly bias: Sell (Last Close Below Weekly Pivot)
- • Strongest signals occur when daily and weekly trends align
Daily prediction for the week
| Day | Target Value |
|---|---|
| Monday | ₹372.23 |
| Tuesday | ₹374.44 |
| Wednesday | ₹377.92 |
| Thursday | ₹381.39 |
| Friday | ₹383.54 |
Possible short term targets for ABCAPITAL in coming days if the stock remains bullish through the week.
- • The initial target value for ABCAPITAL on Monday is projected to be ₹372.23.
- • With favorable market conditions, the target value on Wednesday could reach ₹377.92.
- • By the end of the week, the target value for ABCAPITAL on Friday is expected to potentially reach ₹383.54, considering bullish market trends.
Tomorrow's price forecast review for ABCAPITAL
Opening above mean value ₹368.82, will indicate bullish sentiment in Aditya Birla Capital Ltd.. Any dip in price should be considered as an opportunity to Buy the stock. The maximum price that ABCAPITAL can reach tomorrow will be 372.23 if the sentiments remains bullish. Reversal may happen if the price moves too far away from its mean.
If the price action is weak in the morning, then ABCAPITAL may break below its mean. In such a case, keep the first target at 363.13 as minimum, and ₹354.03 as maximum.
Mean value also acts as Support when price is above and Resistance when price is below it. Day Traders can use this point to make long or short entries.
ABCAPITAL's forecast based on the opening price
1. Gap-up opening
If ABCAPITAL opens around 0.50% above the previous close, traders often treat it as a valid gap-up scenario. The levels below provide a structured plan for likely reactions.
1.1 Opening above close but below resistance (372.23)
Trade: Consider a sell near ₹372.23.
Target: Pivot at ₹368.82.
Rationale: This setup seeks a mean‑reversion move back to the pivot.
When to avoid:
- Keep stop loss above 372.23 (5‑min close).
- Skip if risk‑reward is not favorable.
1.2 Opening above resistance (372.23)
Trade: Consider a buy after a 5‑minute close above 372.23.
Target: R2 at 377.92, extend to R3 at 381.33.
Rationale: Opening above resistance suggests momentum continuation.
When to avoid:
- Keep stop below 372.23.
- Avoid if the last 3 sessions show a downtrend.
2. Gap-down opening
A gap-down (about 0.30% below the previous close) changes the bias to the downside. The scenarios below explain how ABCAPITAL may react after such an open.
2.1 Opening below close but above low
Trade: Consider a buy at ₹363.13 if support holds.
Target: Pivot at ₹368.82.
Rationale: If price holds above the prior low, a bounce toward the pivot is possible.
When to avoid:
- Stop below S1 at 363.13.
- Skip if broader market sentiment is negative.
2.2 Breaking below today's low
Trade: Consider a sell on a pullback near the pivot at 368.82.
Target: S1 at 363.13 with a minimum 1:1 risk‑reward.
Rationale: A break of the prior low signals bearish pressure and potential continuation.
When to avoid:
- Exit if price closes above the pivot.
- Avoid selling into major support zones.
Note: If higher‑timeframe trend is bullish, consider waiting for a long near S1 instead.
3. Flat Opening
ABCAPITAL opening near previous day close price will be considered as a flat open. Below is detailed explanation of how stock may perform based on price action.
3.1 General Trend Overview
Since today was a bullish day in ABCAPITAL, this trend might continue tomorrow as well. However, flat opening suggests neutral sentiments or continuation of previous day trend. So this section will consider both cases depending on how price action is in the early morning session.
3.2 Bearish Price Action
Action: If price action is weak and the stock is making lows, traders can consider creating a (Sell) entry once the mean value 368.82 is broken.
Target: Aim for a target up to the previous day's low of 365.40 and after achieving TP1, extend targets further up to 372.23.
Rationale: This strategy leverages the bearish trend continuation after an initial flat opening.
3.3 Bullish Price Action
Action: If ABCAPITAL starts the day on a bullish note, its targets will be 372.23 and 377.92.
Rationale: Using this intraday strategy, traders can capitalize on the bullish momentum.
When to Avoid:
- • Keep SL below 368.82 on a candle closing basis (exit when a 5-minute candle closes below pivot).
- • Avoid this trade if the previous day was in a downtrend.
ABCAPITAL's vs. Nifty's Performance
Above charts shows close price comparison of ABCAPITAL and Nifty 50 for past 7 days highlighting how stocks performance compared to the flagship index.
Overview of Returns
| Period | ABCAPITAL's Returns | Nifty's Returns |
|---|---|---|
| Daily | 2.57% | 0.11% |
| Weekly | 0.66% | -1.31% |
| Monthly | -0.58% | 0.94% |
Today, ABCAPITAL returned 2.57% while the Nifty returned 0.11%.
Previous week, the stock returned 0.66% compared to -1.31% return of flagship index Nifty.
In the Last one month, shares of ABCAPITAL presented return of -0.58%, where as Nifty stands at 0.94% returns.
ABCAPITAL's Volatility Analysis
Chart above shows volatility and price comparison of ABCAPITAL's over last 3 months. Volatility often referred to as IV is important in intraday trading since it gives insights on where stop loss and profit booking levels can be. For stock with higher volatility, its suggested to place a bigger stop loss since price movements can be aggressive.
Range Analysis
Based on the current close price of ₹366.55, the upcoming session is expected to be neutral/trend continuation.
Predicted share price range for tomorrow is: High ₹375.11 and Low ₹357.99.
Should you hold ABCAPITAL tomorrow?
Weekly Pivot Analysis
Last Close: ₹366.55
Weekly Pivot: ₹368.82
Status: The stock closed below the weekly pivot, indicating potential resistance and a negative outlook for tomorrow.
Why This Matters?
Pivot points are used to identify potential support and resistance levels. Stocks closing below the weekly pivot are considered to have a bearish sentiment, suggesting that the stock may decline, which is why a "Sell" recommendation is made.
ABCAPITAL target tomorrow — FAQs
What is ABCAPITAL's target tomorrow?
Tomorrow’s targets are framed by pivot levels: R1–R3 on the upside and S1–S3 on the downside. These levels map the most likely intraday reaction zones.
How do you calculate ABCAPITAL's target tomorrow?
We use prior day OHLC data to compute Standard, Fibonacci, and Camarilla pivot points. These models produce structured support and resistance levels for intraday planning.
Which pivot system is most reliable for intraday?
Standard pivots are widely followed. Fibonacci pivots highlight proportional moves, while Camarilla pivots are useful for tighter intraday ranges.
How should I use targets with risk control?
Plan entries near the pivot, set stops beyond S1/R1, and scale exits at R1/R2 or S1/S2. This keeps risk defined and avoids emotional trades.
Does weekly bias matter for tomorrow’s targets?
Yes. If price is above the weekly pivot, upside targets have higher odds; below it, downside targets are prioritized.
Are targets valid on gap‑up or gap‑down days?
Yes, but the sequence changes. Gap‑up days often test R1/R2 quickly; gap‑down days focus on S1/S2.
Are ABCAPITAL's targets guaranteed?
No. Targets are probabilistic levels based on prior price structure. Always apply risk management.
Blog Updates
Loading posts...
Top Gainers
Top Losers
Trending Stocks
Stocks in Focus
Loading posts...