ABM International Limited (ABMINTLLTD) Stock Price Target Analysis for Tomorrow
ABM International Limited
Symbol: NSE: ABMINTLLTD
Sector: Loading... / Loading...
₹31.35 52W High
₹110.62
Last Close: ₹58
Last Update: 2025-10-10
ABMINTLLTD Today's Performance
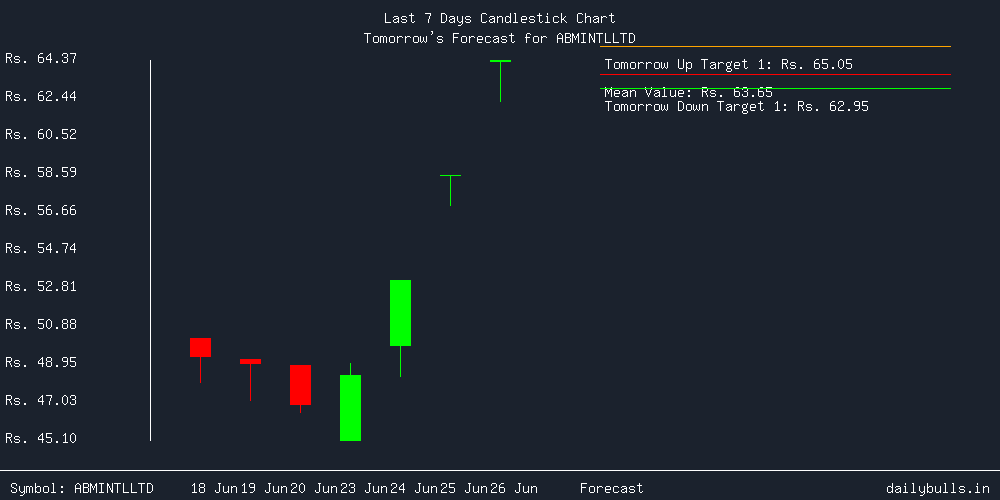
ABMINTLLTD opened today at ₹54.5 and marked a high of ₹59.6. The low price was ₹52.1 and the stock finally closed at ₹58. This data is crucial to forecast ABMINTLLTD's targets for tomorrow's day trading session. Learn more
Today, shares of ABM International Limited closed above previous closing, which is evident from the formation of Higher High. In the coming days, the stock may continue to rise, suggesting a bullish forecast.
Strength Matrix graph shows how ABMINTLLTD might perform tomorrow by highlighting its price strength, momentum, volatility, and trend direction. Tracking these short-term trends daily can help better understand changes in the market.
Strength Matrix
Technical overview of how the stock may perform in the upcoming session.
Technical Strength and Weaknesses
Understanding strengths and weaknesses in technical indicators is important as these points will help to decide whether or not to trade ABMINTLLTD tomorrow.
Strengths
- Expect moderate bullish behavior.
- ADX points to a solid bullish trend emerging.
- SAR predicts a robust bullish trend for tomorrow, with recent positive crossovers supporting upward momentum.
- SAR signals a potential bullish reversal, possible upward movement.
Potential Weaknesses
- RSI suggests overbought conditions, indicating potential for a pullback or correction.
- The price is significantly below the SMA, highlighting strong bearish momentum with high market volatility and a consistent downward trend.
Similar Stocks like ABM International Limited
Blog Updates
Loading posts...
Daily prediction for the week
| Day | Target Value |
|---|---|
| Monday | ₹61.03 |
| Tuesday | ₹61.20 |
| Wednesday | ₹64.07 |
| Thursday | ₹66.93 |
| Friday | ₹68.70 |
Possible short term targets for ABMINTLLTD in coming days if the stock remains bullish through the week.
- • The initial target value for ABMINTLLTD on Monday is projected to be ₹61.03.
- • With favorable market conditions, the target value on Wednesday could reach ₹64.07.
- • By the end of the week, the target value for ABMINTLLTD on Friday is expected to potentially reach ₹68.70, considering bullish market trends.
Tomorrow's price forecast review for ABMINTLLTD
Opening above mean value ₹56.57, will indicate bullish sentiment in ABM International Limited. Any dip in price should be considered as an opportunity to Buy the stock. The maximum price that ABMINTLLTD can reach tomorrow will be 61.03 if the sentiments remains bullish. Reversal may happen if the price moves too far away from its mean.
If the price action is weak in the morning, then ABMINTLLTD may break below its mean. In such a case, keep the first target at 53.53 as minimum, and ₹46.03 as maximum.
Mean value also acts as Support when price is above and Resistance when price is below it. Day Traders can use this point to make long or short entries.
ABMINTLLTD's Tomorrow's Forecast Based On Opening Price
1. Gap Up Opening
This section provides insights on how ABMINTLLTD may perform if it opens with a gap up tomorrow. Typically, opening 0.50% above previous close is considered as a valid gap.
1.1 Opening Above Today's Close but Below Resistance (61.03)
Trade: Enter a SELL position when the stock reaches ₹61.03.
Target: Keep target price at ₹56.57.
Rationale: This strategy aims to capture the early morning pullback move towards the mean value.
When to Avoid:
- • Keep Stop Loss above 61.03 (5 min candle closing basis).
- • Avoid when risk to reward is not favorable.
1.2 Opening Above Resistance (61.03)
Trade: Initiate a BUY position when the first candle (5 min) closes above 61.03
Target: Aim for the first target of 64.07 later, trail up to 68.53.
Rationale: ABMINTLLTD opening above Resistance (61.03) suggests a strong bullish sentiment. This way, traders can gain the advantage of a possible upmove.
When to Avoid:
- • Remember to keep SL below 61.03.
- • Do not trade this strategy if the stock is in a downtrend in the last 3 days.
2. Gap Down Opening
Opening below 0.3% of previous day close is considered as a gap down opening. Section below explains how ABMINTLLTD may perform considering price action after gap down opening.
2.1 Opening Below Today's Close but Above Low Price
Trade: Place a BUY order at ₹53.53.
Target: Place an exit order at ₹56.57 making it an intraday target.
Rationale: If ABMINTLLTD does not make a low below its previous low, the trend may still be higher highs on the daily timeframe. This presents us with a Buy opportunity once the price retraces downside near its support.
When to Avoid:
- • Place SL below support 53.53.
- • Do not trade this when close and low price are close to each other, or if the market is negative.
2.2 Breaking Below Today's Low
Trade: Enter a SELL position in ABMINTLLTD when it finds resistance near 56.57.
Target: Aim for a minimum 1:1 risk-reward and keep a target of 53.53. Accuracy is better if this happens after 10:15 AM.
Rationale: Breaking below previous day low signifies bearish pressure. In case the stock retraces upside, it may present traders with a good opportunity to open a new sell position to gain benefit from the bearishness in stock.
When to Avoid:
- • Exit if the stock closes above 56.57.
- • Avoid selling when it's trading near a major support area.
Additional Note: If the trend is bullish on a higher timeframe, it is suggested to enter a long position instead when the share price reaches 53.53.
3. Flat Opening
ABMINTLLTD opening near previous day close price will be considered as a flat open. Below is detailed explanation of how stock may perform based on price action.
3.1 General Trend Overview
Since today was a bullish day in ABMINTLLTD, this trend might continue tomorrow as well. However, flat opening suggests neutral sentiments or continuation of previous day trend. So this section will consider both cases depending on how price action is in the early morning session.
3.2 Bearish Price Action
Action: If price action is weak and the stock is making lows, traders can consider creating a (Sell) entry once the mean value 56.57 is broken.
Target: Aim for a target up to the previous day's low of 52.1 and after achieving TP1, extend targets further up to 61.03.
Rationale: This strategy leverages the bearish trend continuation after an initial flat opening.
3.3 Bullish Price Action
Action: If ABMINTLLTD starts the day on a bullish note, its targets will be 61.03 and 64.07.
Rationale: Using this intraday strategy, traders can capitalize on the bullish momentum.
When to Avoid:
- • Keep SL below 56.57 on a candle closing basis (exit when a 5-minute candle closes below pivot).
- • Avoid this trade if the previous day was in a downtrend.
ABMINTLLTD's vs. Nifty's Performance
Above charts shows close price comparison of ABMINTLLTD and Nifty 50 for past 7 days highlighting how stocks performance compared to the flagship index.
Overview of Returns
| Period | ABMINTLLTD's Returns | Nifty's Returns |
|---|---|---|
| Daily | 4.39% | 0.41% |
| Weekly | 43.81% | 1.81% |
| Monthly | 34.57% | 1.25% |
Today, ABMINTLLTD returned 4.39% while the Nifty returned 0.41%.
Previous week, the stock returned 43.81% compared to 1.81% return of flagship index Nifty.
In the Last one month, shares of ABMINTLLTD presented return of 34.57%, where as Nifty stands at 1.25% returns.
ABMINTLLTD's Volatility Analysis
Chart above shows volatility and price comparison of ABMINTLLTD's over last 3 months. Volatility often referred to as IV is important in intraday trading since it gives insights on where stop loss and profit booking levels can be. For stock with higher volatility, its suggested to place a bigger stop loss since price movements can be aggressive.
Range Analysis
Based on the current close price of ₹58, the upcoming session is expected to be bullish.
Predicted share price range for tomorrow is: High ₹60.13 and Low ₹55.87.
Should you hold ABMINTLLTD tomorrow?
Weekly Pivot Analysis
Last Close: ₹58.00
Weekly Pivot: ₹56.57
Status: The stock closed above the weekly pivot, indicating potential support and a positive outlook for tomorrow.
Why This Matters?
Pivot points are used to identify potential support and resistance levels. Stocks closing above the weekly pivot are considered to have a bullish sentiment, suggesting that the stock may continue to rise, which is why a "Hold" recommendation is made.
Top Gainers
Top Losers
Trending Stocks
Stocks in Focus
Loading posts...