20 EMA Pullback Strategy Backtest on Nifty 50 Stocks
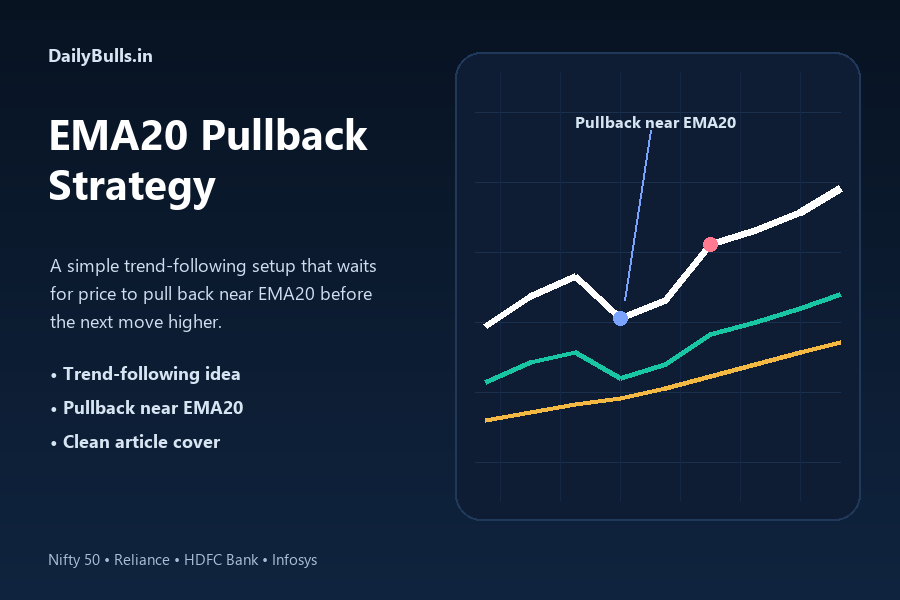
The 20 EMA pullback strategy is a trend-following setup that looks for a buy entry when price pulls back toward the 20-day exponential moving average while the broader uptrend is still intact. In this backtest, I used Nifty 50, Reliance, HDFC Bank, and Infosys to see how that idea behaved on real charts.
The short version is simple. The setup produced a usable baseline in this four-instrument basket, but the edge was uneven across symbols. It worked best as a way to rejoin an existing uptrend, not as a high-accuracy signal that wins all the time.
20 EMA pullback strategy at a glance
| Item | Detail |
|---|---|
| Primary setup | Buy a pullback near the 20 EMA inside a larger uptrend |
| Trend filter | Close above the 200-day moving average |
| Entry | Next session open after the signal candle |
| Exit | First close back below the 20 EMA |
| Instruments tested | Nifty 50, Reliance, HDFC Bank, Infosys |
| Total trades | 458 |
| Win rate | 45.20% |
| Average return per trade | 0.67% |
| Profit factor | 1.64 |
Those headline numbers only tell part of the story. What matters more is how the setup behaved on the chart and how much the results changed from one instrument to another.
What is the 20 EMA pullback strategy?
The 20 EMA pullback strategy tries to buy a controlled dip in an uptrend instead of chasing price after a sharp move.
The logic is straightforward:
- price is already above the 200-day moving average
- price pulls back toward the 20 EMA
- the trade is taken on the next session open
- the position is closed if price loses the 20 EMA on a closing basis
That is why this idea is popular with swing traders. It is easy to see on a chart, easy to explain, and easy to test.
Rules used in this backtest
The strategy followed four rules in this test:
- Only consider long trades when the close is above the 200-day moving average.
- Treat price as near the 20 EMA when the close is within 1% of the 20 EMA.
- Enter on the next session open after the signal candle.
- Exit on the first close back below the 20 EMA.
The rule set stays intentionally simple. There is no RSI filter, no volume confirmation, and no discretionary override.
Example trade
The chart below shows an example trade from the 20 EMA pullback strategy, with the signal, entry, holding period, and exit marked on the chart.
In the image below:
- the white line is price
- the green line is the 20 EMA
- the gold line is the 200-day moving average
- the yellow marker shows the signal candle
- the green triangle marks the next-day entry
- the X marks the exit
- the shaded section shows how long the trade stayed open
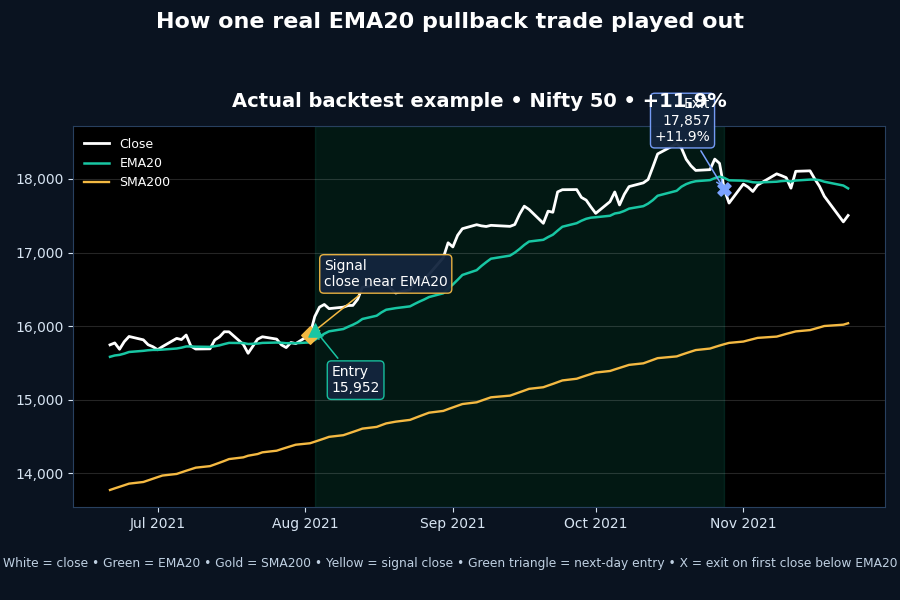
This chart shows the setup behaving like an actual process. Price stayed in an uptrend, pulled back toward the 20 EMA, triggered the signal, and then either resumed higher or failed and closed back below the average.
Backtest results
Here is the headline summary from the 20 EMA pullback strategy backtest:
| Metric | Value |
|---|---|
| Total trades | 458 |
| Win rate | 45.20% |
| Average return per trade | 0.67% |
| Median return per trade | -0.12% |
| Profit factor | 1.64 |
| Max drawdown (trade-sequence view) | -33.41% |
| Average holding period | 13.5 bars |
A few things stand out.
First, the win rate stayed below 50%, so this is clearly not a high-hit-rate setup.
Second, the average trade stayed positive and the profit factor held above 1.5. That usually means the better trend trades were large enough to pay for a long list of smaller losses and scratches.
Third, the outcome changed a lot from one symbol to another.
Symbol-wise results
| Symbol | Trades | Win rate | Avg return/trade | Profit factor |
|---|---|---|---|---|
| Nifty 50 | 121 | 46.28% | 0.64% | 1.89 |
| Reliance | 126 | 43.65% | 1.24% | 2.03 |
| HDFC Bank | 123 | 47.15% | 0.37% | 1.38 |
| Infosys | 88 | 43.18% | 0.31% | 1.22 |
Reliance was the strongest expression of the setup in this basket. Nifty 50 was smoother. HDFC Bank and Infosys still worked to some extent, but the edge was thinner.
That difference across symbols matters because the same setup can look strong on one instrument and only average on another.
₹1 lakh simulation
The next chart looks at how the same rules would have behaved if ₹1,00,000 had been applied to each instrument separately.
This is not a combined portfolio equity curve. It is better to think of it as four separate tracks showing what would have happened if the same rules were applied to one instrument at a time.
In the chart below:
- each line starts at ₹1,00,000
- each line belongs to one instrument
- capital only moves when that instrument is in an open trade
- flat periods mean there was no active trade
- brokerage, slippage, and taxes are not included
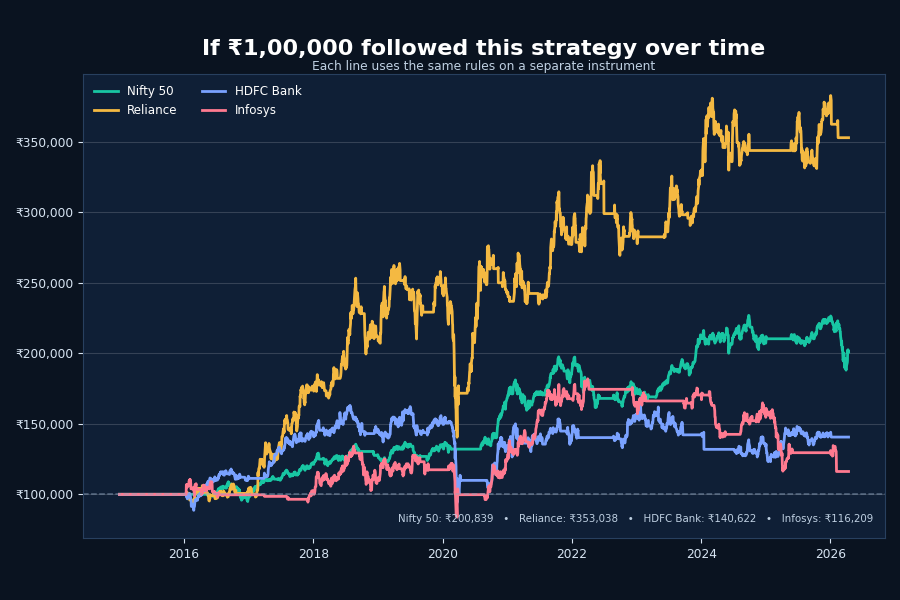
By the end of the test window, the rough outcomes looked like this:
- Nifty 50: ₹2.01 lakh
- Reliance: ₹3.53 lakh
- HDFC Bank: ₹1.41 lakh
- Infosys: ₹1.16 lakh
This chart shows something the summary table cannot. Same rules. Different payoff profiles. That gap matters because it tells us instrument selection still has a big impact even when the setup itself is sensible.
Where the setup worked best
It looked strongest when three things lined up:
- the broader trend was already healthy
- the pullback stayed shallow and controlled
- the next leg up started soon after entry
That is why the setup works better as a participation tool than as a prediction tool. You are not trying to catch the exact low. You are trying to buy a pullback inside a trend that already exists.
Limits of this backtest
The limits matter just as much as the upside before drawing stronger conclusions.
Here are the main ones:
- only four instruments were tested
- no slippage, brokerage, or taxes were included
- this is not a combined portfolio backtest
- strategy research across many variants can create selection bias
- the ₹1 lakh simulation is a simplified instrument-by-instrument view, not a live track record
So the fair conclusion is not that this setup is universally profitable. The fair conclusion is narrower: in this basket, it produced a respectable baseline, but it still needs broader testing before stronger claims are justified.
FAQ about the 20 EMA pullback strategy
What is the 20 EMA pullback strategy?
It is a trend-following setup that buys a dip near the 20-day exponential moving average while price remains above a larger trend filter such as the 200-day moving average.
Does the 20 EMA pullback strategy work on stocks?
In this backtest, it produced a usable baseline on Nifty 50, Reliance, HDFC Bank, and Infosys, but the results varied by instrument.
Is the 20 EMA pullback strategy profitable?
In this backtest, the strategy had a positive average return per trade and a profit factor above 1 in the tested basket. That does not guarantee the same outcome in live trading or on every stock.
What is the exit rule in this setup?
The exit rule used in this backtest was simple: close the trade on the first daily close below the 20 EMA.
Can it be used for swing trading?
Yes. The 20 EMA pullback strategy naturally fits swing trading because it looks for short-to-medium-term continuation moves inside a broader trend.
Final take
Overall, the 20 EMA pullback strategy worked as a reasonable trend-continuation baseline in this basket. It was not a high-accuracy setup, but it did show that buying controlled pullbacks in a broader uptrend can produce usable results when the trend resumes cleanly.
What stands out most is that the setup looked strongest when the larger trend was already healthy and the pullback stayed relatively shallow. It is not a magic signal, but it is simple enough to understand and specific enough to test against other trend-following ideas.
Share this insight
Spread the Alpha
Related Articles
More ideas that align with your trading playbook.

Supertrend Strategy Backtest
Supertrend strategy backtest on Nifty 50, Bank Nifty, Sensex, Maruti Suzuki, Power Grid and Trent, with variant comparison, ticker-wise results and drawdown.
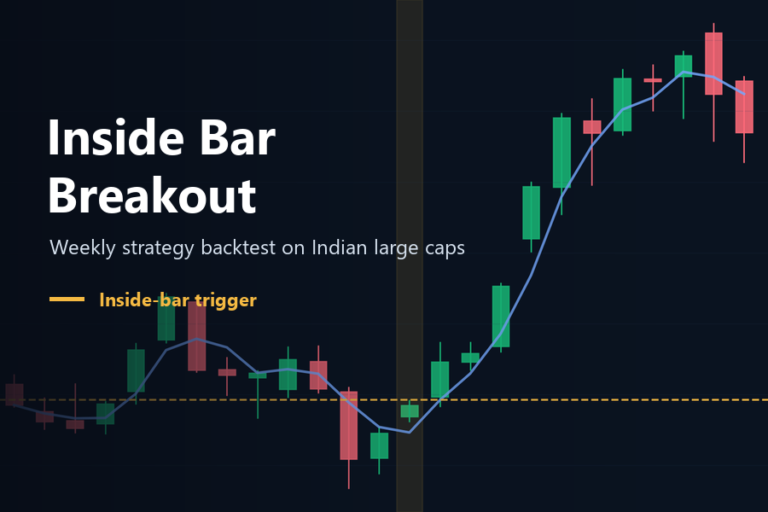
Inside Bar Breakout Strategy Backtest
A weekly inside bar breakout strategy backtest on Nifty 50 and 7 large-cap stocks, with per-ticker win rates, profit factors, drawdowns, and…

EMA 10 20 Crossover Strategy on Indian Large Caps: Where It Worked Best
A daily EMA 10 20 crossover strategy backtest on Nifty 50 and 7 large-cap stocks, with per-ticker win rates, profit factors, drawdowns,…
 DailyBulls (Arthashilpi Ventures) is a D-U-N-S verified company.