
Supertrend Strategy Backtest
The Supertrend strategy is usually explained as a simple indicator flip: buy when the line turns bullish, sell when it turns bearish. That version is easy to understand, but it also hides the more important question, which is whether a better exit or a higher-timeframe filter can improve the result.
This Supertrend strategy backtest tested three long-only versions on Nifty 50, Bank Nifty, Sensex, Maruti Suzuki, Power Grid, and Trent. The cleanest overall result came from a weekly-filtered daily Supertrend setup with a 2.5 ATR trailing exit, not from the plain daily flip-only version.
Across that selected version, the strategy produced 127 trades, a 44.88% win rate, a 2.46% average return per trade, a 2.40 profit factor, and a -22.40% max drawdown. That makes the result more useful than a generic one-rule Supertrend explanation because it comes from direct comparison, not theory alone.
What is the Supertrend strategy?
The Supertrend strategy is a trend-following method built around an ATR-based indicator that sits above or below price.
The basic interpretation is straightforward:
- when the Supertrend line sits below price, the trend is bullish
- when the line sits above price, the trend is bearish
- when the line flips sides, traders treat that as a possible trend change
That simple version is popular because it is visual and easy to apply. The problem is that simple flips can become noisy in choppy conditions. That is why this backtest did not stop at one generic rule. It compared a plain daily version against two cleaner variations.
Three Supertrend versions tested
This backtest compared three versions.
| Version | Entry | Exit | Why it was tested |
|---|---|---|---|
| Daily flip only | Daily bullish Supertrend flip, next day open | Daily bearish flip, next day open | Baseline version most readers already know |
| Daily flip + 2.5 ATR trail | Daily bullish Supertrend flip, next day open | Bearish flip or 2.5 ATR trailing break, next day open | Checks whether a volatility-based exit improves trade management |
| Weekly filter + daily flip + 2.5 ATR trail | Previous completed weekly Supertrend must already be bullish, then daily bullish flip, next day open | Bearish flip or 2.5 ATR trailing break, next day open | Checks whether a higher-timeframe filter reduces noise |
Which version looked best?
| Version | Trades | Win rate | Avg return/trade | Profit factor | Max drawdown | Avg bars held |
|---|---|---|---|---|---|---|
| Daily flip only | 220 | 49.09% | 2.84% | 2.39 | -39.93% | 42.00 |
| Daily flip + 2.5 ATR trail | 220 | 47.73% | 2.26% | 2.23 | -38.63% | 31.51 |
| Weekly filter + daily flip + 2.5 ATR trail | 127 | 44.88% | 2.46% | 2.40 | -22.40% | 30.21 |
The daily flip-only version had the highest average return per trade, but the drawdown stayed much deeper. The weekly-filtered version cut the drawdown sharply while still keeping the average return per trade and profit factor strong enough to remain interesting.
That is why the weekly-filtered version is the main method used in the rest of this article.
Rules used in this backtest
The selected version used five rules:
- The previous completed weekly Supertrend had to remain bullish.
- The daily Supertrend had to flip from bearish to bullish on the close.
- Entry happened on the next session open.
- Exit happened on the next session open if the daily Supertrend flipped bearish.
- Exit also happened on the next session open if price closed below the highest close since entry minus 2.5 ATR(14).
This was a long-only test. No short trades, no leverage, and no same-bar execution assumptions were used.
Supertrend strategy at a glance
| Item | Detail |
|---|---|
| Main method | Weekly filter + daily Supertrend flip + 2.5 ATR trail |
| Direction | Long only |
| Indicator setting used | Supertrend based on ATR(14), multiplier 3 |
| Entry timing | Next session open |
| Exit timing | Next session open |
| Basket tested | Nifty 50, Bank Nifty, Sensex, Maruti Suzuki, Power Grid, Trent |
| Timeframes used | Weekly filter, daily execution |
One important detail matters here. The weekly filter used the previous completed weekly signal only. That keeps the test cleaner because it avoids using the still-forming current week as a decision input.
What this strategy looks like on chart
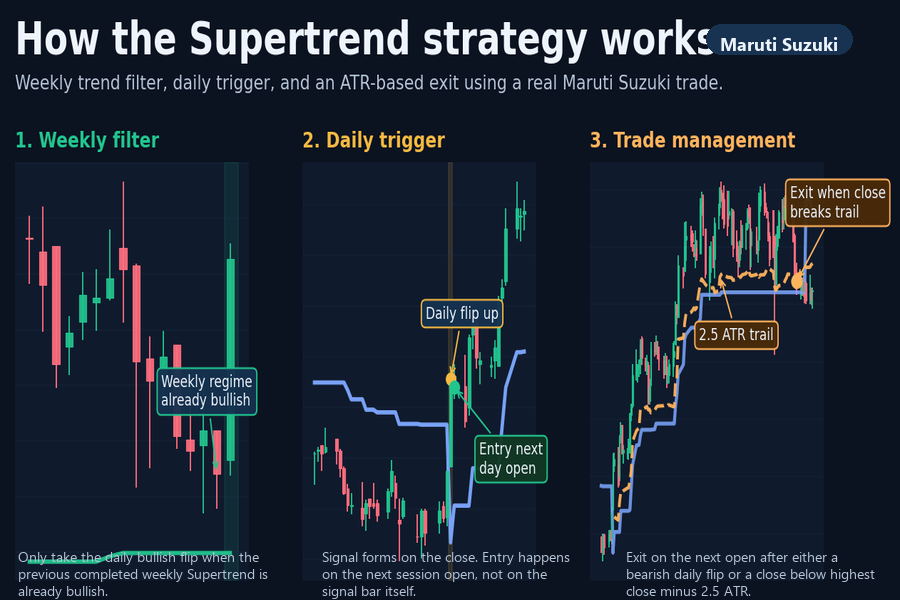
This visual matters because the strategy is not just a plain indicator flip. The weekly trend filter decides when a daily signal is allowed, and the ATR-based trailing rule helps define how the trade is managed after entry.
Results from Supertrend strategy
| Metric | Result |
|---|---|
| Total trades | 127 |
| Wins | 57 |
| Losses | 70 |
| Win rate | 44.88% |
| Avg return per trade | 2.46% |
| Median return per trade | -0.89% |
| Avg winning trade | 9.41% |
| Avg losing trade | -3.19% |
| Profit factor | 2.40 |
| Max drawdown | -22.40% |
| Best trade | 39.81% |
| Worst trade | -13.01% |
| Avg holding period | 30.21 bars |
The win rate was not especially high, but that is not unusual for a trend-following system. The more important point is that the winners were large enough to outweigh the losers by a comfortable margin.
If ₹100,000 was invested in this basket
Because signals overlapped across multiple symbols, the ₹100,000 capital view below uses a cleaner basket model: the starting capital was split equally across the six instruments, each sleeve compounded independently, and the basket equity was then summed together.
| Basket capital metric | Result |
|---|---|
| Starting capital | ₹100,000 |
| Ending capital | ₹183,356 |
| Net profit | ₹83,356 |
| Return on starting capital | 83.36% |
| Gross profit from winning trades | ₹138,188 |
| Gross loss from losing trades | ₹54,832 |
| Profitable trades | 57 |
| Losing trades | 70 |
| Basket max drawdown | -6.39% |
| Basket max drawdown in rupees | ₹9,467 |
| Best trade profit | ₹19,202 |
| Worst trade loss | ₹7,327 |
That capital view is useful because it translates the backtest into a rupee-based basket result instead of leaving everything in percentage terms only.
₹100,000 basket equity curve
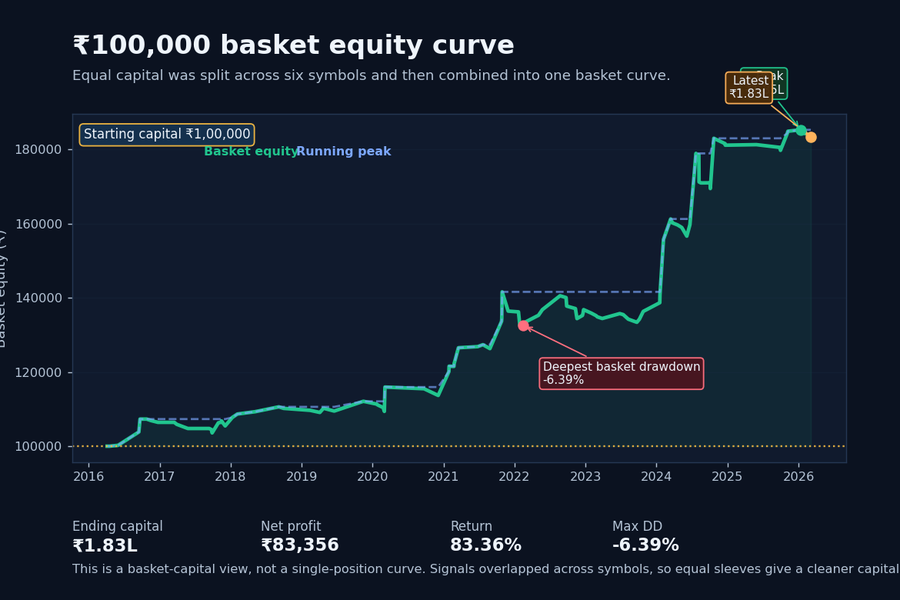
This is the easiest way to see how the strategy performed when capital is viewed as a real portfolio-style basket. The line is not a single-trade sequence. It combines equal sleeves per symbol, which is why the drawdown is cleaner than a raw concatenated trade chart.
₹100,000 basket equity checkpoints
| Year-end checkpoint | Basket equity | Net profit vs ₹100,000 start | Drawdown at checkpoint |
|---|---|---|---|
| 2016 | ₹106,429 | ₹6,429 | -0.82% |
| 2017 | ₹105,458 | ₹5,458 | -1.72% |
| 2018 | ₹110,184 | ₹10,184 | -0.38% |
| 2019 | ₹112,095 | ₹12,095 | 0.00% |
| 2020 | ₹113,674 | ₹13,674 | -1.95% |
| 2021 | ₹136,398 | ₹36,398 | -3.66% |
| 2022 | ₹136,791 | ₹36,791 | -3.38% |
| 2023 | ₹136,318 | ₹36,318 | -3.72% |
| 2024 | ₹181,104 | ₹81,104 | -1.01% |
| 2025 | ₹184,864 | ₹84,864 | 0.00% |
| 2026* | ₹183,356 | ₹83,356 | -1.02% |
*2026 reflects the latest completed trade in this backtest sample, not a full calendar year.
Ticker-wise backtest results
| Ticker | Trades | Wins | Losses | Win rate | Avg return/trade | Profit factor | Max drawdown |
|---|---|---|---|---|---|---|---|
| Nifty 50 | 22 | 10 | 12 | 45.45% | 1.50% | 2.29 | -7.86% |
| Bank Nifty | 20 | 7 | 13 | 35.00% | -0.57% | 0.69 | -19.49% |
| Sensex | 22 | 10 | 12 | 45.45% | 1.92% | 2.82 | -5.40% |
| Maruti Suzuki | 16 | 9 | 7 | 56.25% | 3.18% | 2.87 | -9.28% |
| Power Grid | 24 | 7 | 17 | 29.17% | 0.74% | 1.30 | -22.40% |
| Trent | 23 | 14 | 9 | 60.87% | 7.83% | 4.51 | -22.14% |
The ticker split is the most useful part of the study because the same strategy behaved very differently across the basket.
What the ticker split says
Strongest fits
Trent was the standout name.
- 23 trades
- 60.87% win rate
- 7.83% average return per trade
- 4.51 profit factor
- best trade of 39.81%
That is the type of profile that makes a trend-following system look worthwhile.
Maruti Suzuki was the cleanest balanced stock result.
- 16 trades
- 56.25% win rate
- 3.18% average return per trade
- 2.87 profit factor
- only -9.28% max drawdown in this test
Usable index results
Sensex and Nifty 50 were both constructive.
- Sensex posted a 1.92% average return per trade with a 2.82 profit factor.
- Nifty 50 posted a 1.50% average return per trade with a 2.29 profit factor.
That matters because it shows the rule was not dependent on one unusually strong stock.
Weak or mixed fits
Bank Nifty was the weakest result in the basket.
- 20 trades
- 35.00% win rate
- -0.57% average return per trade
- 0.69 profit factor
That is a weak outcome for this exact rule set.
Power Grid looked mixed rather than outright broken.
The win rate was only 29.17%, but the average return per trade stayed positive. That usually means the winners were large enough to keep the profile alive, even though the strike rate was poor.
How the exits actually behaved
The exit mix adds useful context because it shows how trades were really being closed.
| Exit reason | Trades | Share of trades | Avg return/trade | Avg bars held |
|---|---|---|---|---|
| Bearish daily Supertrend flip | 60 | 47.24% | 3.47% | 33.48 |
| Close below highest close since entry minus 2.5 ATR | 67 | 52.76% | 1.56% | 27.28 |
A little over half the trades exited through the ATR-based trailing rule rather than the opposite Supertrend flip. That makes the hybrid design more than just a cosmetic tweak. The trailing exit was active often enough to shape the result meaningfully.
Sample winning trade
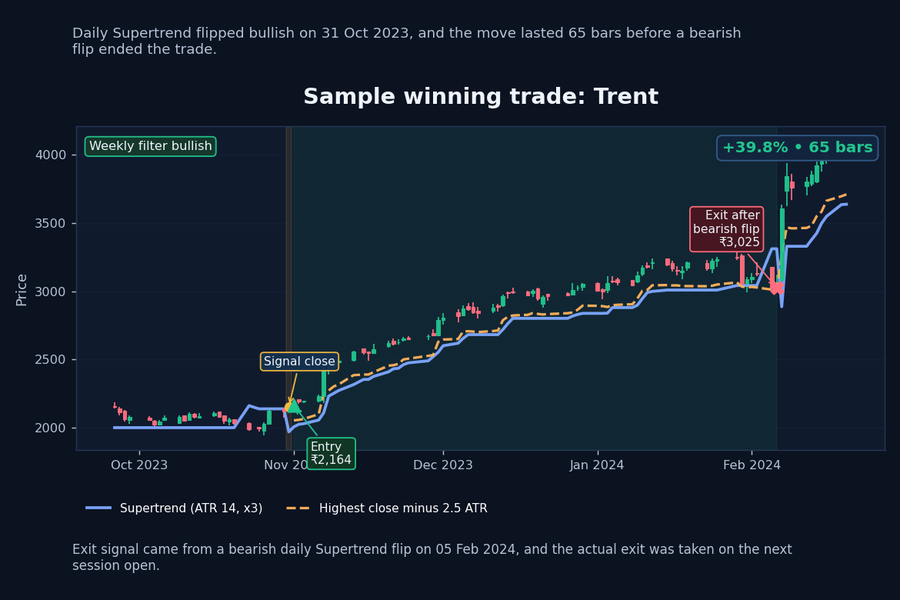
This example is useful because it shows what a strong trend-following outcome actually looked like in the backtest. The setup passed the weekly filter, the daily Supertrend turned bullish, and the move kept running long enough for the strategy to capture a meaningful trend.
Sample failed trade
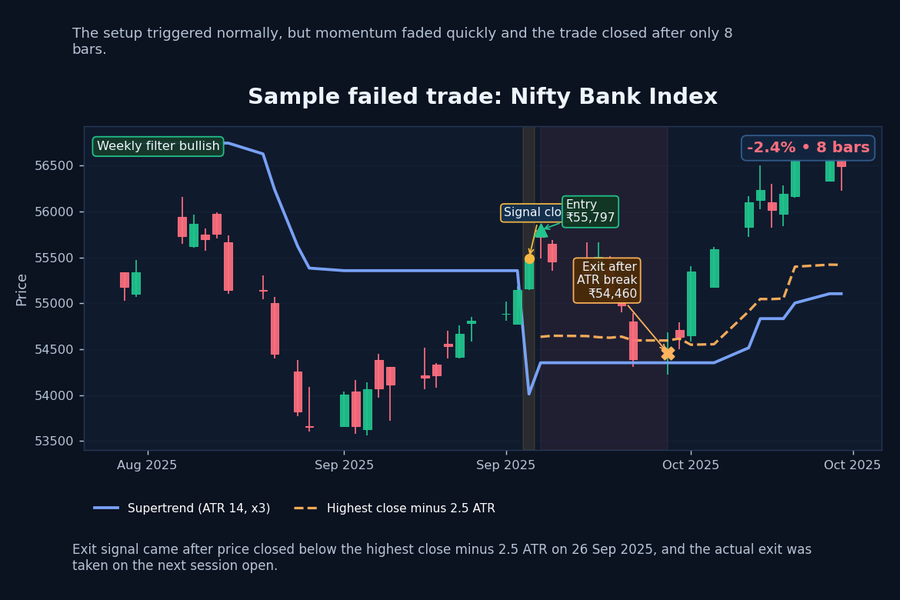
This example is useful for balance. It shows why trend filters help, but do not eliminate every false start, especially in a volatile instrument. The entry was still valid by our rules, yet momentum weakened before the move could develop, which is exactly the risk profile this kind of strategy must manage.
Why the weekly filter stood out
The weekly filter did two useful things.
First, it cut the trade count from 220 to 127. That means fewer daily flips were allowed through.
Second, it reduced the max drawdown from roughly -40% in the daily-only versions to about -22.40% in the filtered version.
That is the real reason this version stands out. It is not the most aggressive variant. It is the version that produced the cleanest balance between participation and pain.
Where the strategy worked and where it struggled
This Supertrend strategy looked better when:
- the stock or index already had a clean higher-timeframe trend
- pullbacks stayed contained instead of turning into full reversals
- the trend persisted for several weeks after the daily trigger
It looked worse when:
- price flipped direction too often
- the higher-timeframe trend was not especially stable
- the market became choppy enough for repeated false starts
Bank Nifty was the clearest reminder of that weakness. Trent was the clearest example of how well the strategy can look when trend persistence is strong.
Limits of this backtest
A few limits are worth keeping in mind:
- the basket was still only six instruments
- no slippage, brokerage, or taxes were included
- this was a long-only study, not a long-short system
- the strategy was tested on daily and weekly data only, not intraday data
- the ₹100,000 basket view used equal starting capital across the six symbols and updated equity on trade exits, not daily mark-to-market portfolio accounting
- sequentially compounded backtest returns should not be treated as a live portfolio CAGR
So this result is useful, but it is not proof that the same rule will work equally well on every stock or index.
FAQ about the Supertrend strategy
What is the best Supertrend setting?
There is no universal best setting. This backtest used a Supertrend based on ATR(14) with multiplier 3 and then improved the basic daily flip by adding a weekly filter and a 2.5 ATR trailing exit.
Is the plain Supertrend flip enough on its own?
It can work, but this test suggests the plain daily flip version carried much deeper drawdown. The weekly-filtered version was cleaner overall.
Did Supertrend work better on indices or stocks in this backtest?
The result was mixed. Trent and Maruti Suzuki were stronger than Bank Nifty. Nifty 50 and Sensex were constructive, but not as explosive as Trent.
Why use a weekly filter with a daily entry?
The weekly filter helps remove some of the daily noise. In this test, it reduced trade count and cut drawdown materially without destroying the return profile.
Is this a long-only Supertrend strategy?
Yes. This backtest used long-only rules.
Final take
This Supertrend strategy backtest answered a more useful question than a standard indicator explainer.
Instead of asking whether Supertrend can generate buy and sell signals, it asked which version of the strategy held up best on a mixed India-focused basket. The answer was clear enough: the weekly-filtered daily Supertrend with a 2.5 ATR trailing exit produced the cleanest overall profile.
That does not make it a perfect strategy. Bank Nifty was weak, Power Grid was mixed, and trend-following systems will always struggle in choppy phases. But the ticker-by-ticker split shows that the method had enough edge on Trent, Maruti Suzuki, Sensex, and Nifty 50 to justify further study.
Share this insight
Spread the Alpha
Related Articles
More ideas that align with your trading playbook.
Inside Bar Breakout Strategy Backtest
A weekly inside bar breakout strategy backtest on Nifty 50 and 7 large-cap stocks, with per-ticker win rates, profit factors, drawdowns, and…

EMA 10 20 Crossover Strategy on Indian Large Caps: Where It Worked Best
A daily EMA 10 20 crossover strategy backtest on Nifty 50 and 7 large-cap stocks, with per-ticker win rates, profit factors, drawdowns,…
MACD Zero Line Strategy Backtest on Nifty 50 Stocks
A backtest of the MACD zero line strategy on Nifty 50, Reliance, HDFC Bank, and Infosys with chart examples, exit analysis, and…
 DailyBulls (Arthashilpi Ventures) is a D-U-N-S verified company.