MACD Zero Line Strategy Backtest on Nifty 50 Stocks
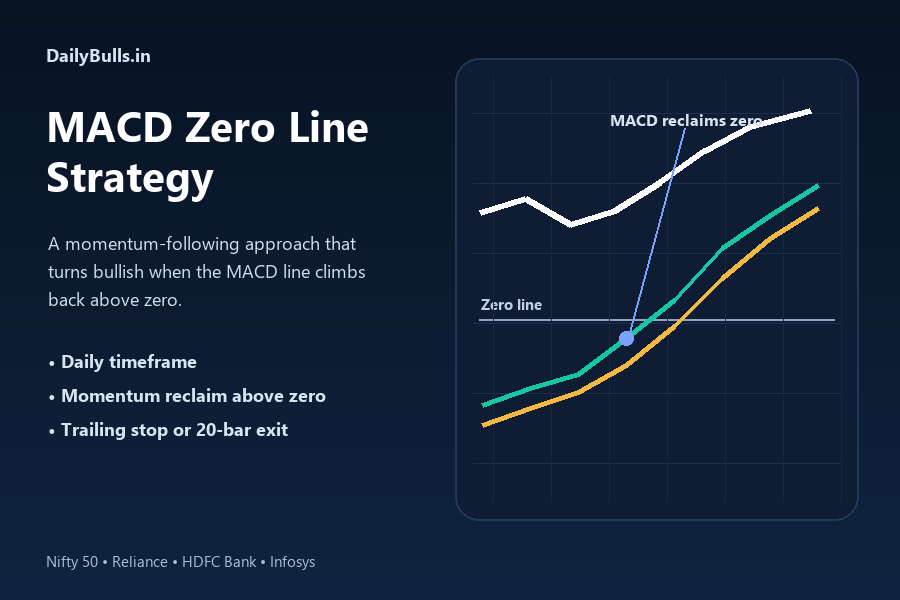
This MACD zero line strategy backtest tests a very simple momentum idea on Indian large-cap names: buy when the MACD line crosses back above zero, then manage the trade with a 2 ATR trailing stop or a 20-bar time exit.
The rule was tested on Nifty 50, Reliance, HDFC Bank, and Infosys. That makes this a MACD zero line strategy on stocks study, not just an index-only test. For Indian traders, it also works as a MACD zero line strategy India example built on local market data. The strategy did not behave the same way on every symbol, but the result was strong enough to earn a proper write-up.
What is the MACD zero line strategy?
The MACD zero line strategy is a momentum setup. It does not try to buy the exact bottom. It waits for momentum to turn positive again and only then takes the trade.
Many traders also call this a MACD zero line crossover strategy because the signal appears when the MACD line crosses above zero. Some describe the same idea more loosely as a MACD above zero strategy. The label changes, but the core logic is the same: momentum has moved back into positive territory.
The core signal is simple:
- the MACD line measures the gap between a faster moving average and a slower moving average
- when the MACD line is below zero, short-term momentum is weaker than the longer-term reference
- when the MACD line moves above zero, short-term momentum has improved enough to flip positive
- that move back above zero is the trigger this strategy uses
In plain English, the setup is asking: has the market stopped acting weak and started acting strong again?
If the answer looks like yes, the trade is taken on the next session open.
That is why this works better as a continuation setup than a reversal setup. The goal is not to catch the first bounce from a messy decline. The goal is to wait for evidence that momentum has already turned.
There is a trade-off, of course. The very first part of the move is usually missed. But that is also the point. The entry is based on confirmation, not hope.
This kind of signal usually looks best in stocks or indices that can trend cleanly for a while. In choppy markets, the MACD line can jump around the zero level and produce weak signals. In steadier trends, the same rule can keep the strategy on the right side of the move without adding too much complexity.
MACD zero line strategy at a glance
| Item | Detail |
|---|---|
| Primary setup | Buy when the MACD line crosses back above zero |
| Indicator | Standard MACD-style momentum reclaim above the zero line |
| Entry | Next session open after the signal candle |
| Exit | 2 ATR trailing stop or 20-bar exit |
| Instruments tested | Nifty 50, Reliance, HDFC Bank, Infosys |
| Total trades | 141 |
| Win rate | 50.35% |
| Average return per trade | 1.26% |
| Profit factor | 1.89 |
That table is the short version. The next sections show where those numbers came from and where the strategy was weaker.
Rules used in this backtest
The test used four rules:
- Wait for the MACD line to cross above zero.
- Treat that candle as the signal day.
- Enter on the next session open.
- Exit on either a 2 ATR trailing stop or the 20th holding bar, whichever comes first.
That is the full rule set. No volume filter. No trendline overlay. No discretionary override on exits.
Example trade
The chart below shows an example trade from the MACD zero line strategy, with the signal, entry, holding period, and exit marked on the chart.
In the image below:
- the top panel shows price
- the bottom panel shows the MACD line, signal line, histogram, and the zero line
- the dashed vertical marker shows the signal day
- the entry happens on the next session open
- the exit is marked at the point where the trade closed under the test rules
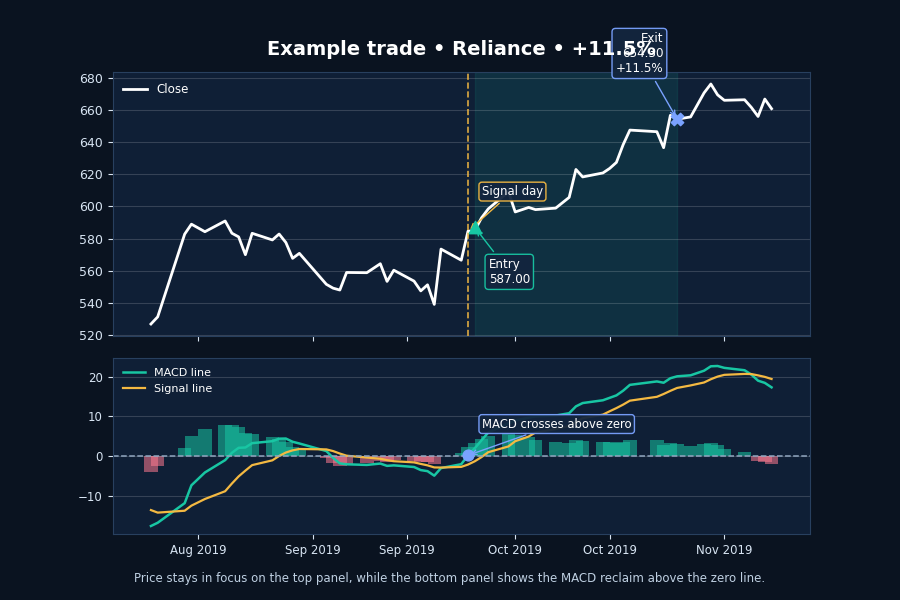
This is the kind of move the setup needs. Momentum flips positive, price follows through, and the trade stays alive long enough for the trend to matter.
MACD zero line strategy backtest results
Here are the core numbers from the test:
| Metric | Value |
|---|---|
| Total trades | 141 |
| Win rate | 50.35% |
| Average return per trade | 1.26% |
| Median return per trade | 0.23% |
| Profit factor | 1.89 |
| Max drawdown (trade-sequence view) | -21.41% |
| Average holding period | 14.39 bars |
| Best trade | 18.05% |
| Worst trade | -8.10% |
A few numbers matter more than the rest.
The win rate was a little above 50%, which is decent for a simple momentum rule. The average return per trade cleared 1%, which gives the system some room to absorb real-world friction later. The profit factor of 1.89 is especially important because it suggests the winners were large enough to pay for the losers without needing a tiny handful of miracle trades.
The median return was only 0.23%, so this was not a smooth, uniform strategy. The bigger winners still did most of the work.
Symbol-wise results
| Symbol | Trades | Win rate | Avg return/trade | Profit factor |
|---|---|---|---|---|
| Nifty 50 | 31 | 54.84% | 1.43% | 2.60 |
| Reliance | 44 | 52.27% | 1.56% | 1.78 |
| HDFC Bank | 33 | 48.48% | 0.80% | 1.56 |
| Infosys | 33 | 45.45% | 1.18% | 2.06 |
Reliance gave the strongest average return per trade. Nifty 50 was the steadiest on profit factor. Infosys won less often, but the winners ran far enough to keep the overall profile strong. HDFC Bank still worked, though the edge looked thinner there.
That matters because it means the result was not driven by one lucky chart. At the same time, it was not equally strong everywhere. Symbol selection still matters.
Exit profile: trailing stop vs 20-bar exit
The exits explain a lot of the strategy.
| Exit reason | Trades | Average return | Median return | Positive trades |
|---|---|---|---|---|
| 20-bar exit | 54 | 5.77% | 5.52% | 51 |
| 2 ATR trailing stop | 87 | -1.54% | -1.95% | 20 |
The 20-bar exits were the money-makers. Those trades averaged 5.77%, and 51 of the 54 were profitable.
The trailing stop did the dirty work. Most of those trades lost money, which is fine. That is what the stop was supposed to do. When the signal failed, the stop got the trade out before a small mistake turned into a much larger one.
That split makes sense. It is messy in the way trend systems are supposed to be messy: lots of cut losses, fewer but more meaningful winners.
₹1 lakh simulation
The next chart shows what happened when the same rules were applied as separate ₹1,00,000 tracks for each instrument.
This should not be read as a portfolio curve. It is better to treat it as four separate single-instrument simulations.
In the chart below:
- each line starts at ₹1,00,000
- each line belongs to one instrument
- capital only changes when that instrument is in a trade
- flat periods mean there was no active trade
- brokerage, slippage, and taxes are not included
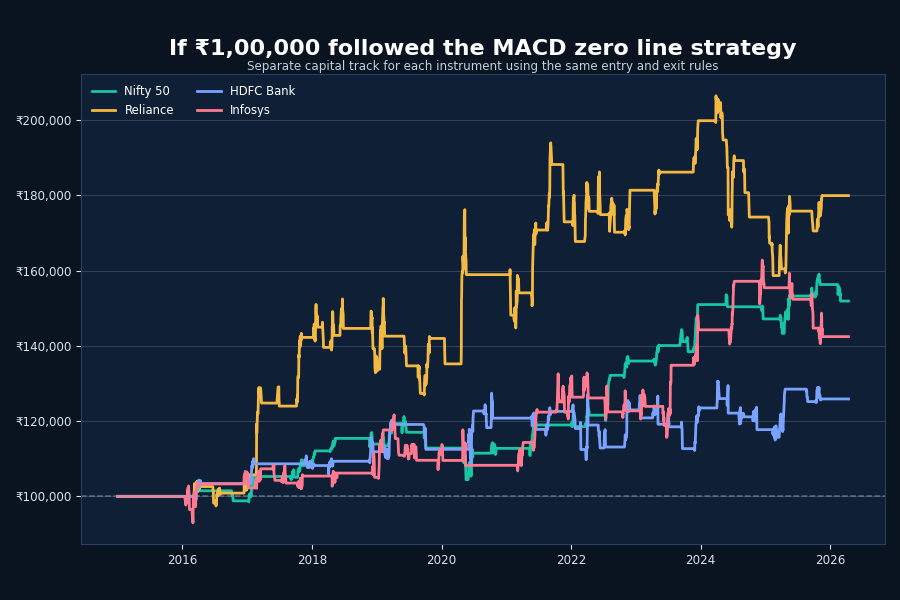
Reliance ended up as the strongest line. Nifty 50 also compounded in a fairly clean way. HDFC Bank and Infosys were bumpier, but they still stayed above the starting capital over the test window.
That lines up with the symbol table. The setup worked across the basket, but it expressed itself much more cleanly in some names than in others.
Where the strategy worked best
This setup liked orderly trends.
It worked best when:
- the broader trend had already stabilized after a weak patch
- the MACD reclaim was followed by clean price follow-through
- the trade did not get shaken out by immediate post-entry volatility
That is the appeal of the zero-line signal. It is late compared with a knife-catch entry, but it is usually cleaner.
Limits of this backtest
This test should not be oversold. The weak spots are obvious:
- only four instruments were tested
- no brokerage, slippage, or taxes were included
- this is not a portfolio-level capital allocation backtest
- strategy research across many variants can create selection bias
- the ₹1 lakh chart is a simplified instrument-by-instrument simulation, not a live record
So no, this does not prove the MACD zero line strategy is universally profitable. What it does show is that this simple rule had a real edge on this small basket, and that is enough to keep digging.
FAQ about the MACD zero line strategy
What is the MACD zero line strategy?
The MACD zero line strategy buys when the MACD line crosses back above zero, which signals that momentum has turned positive again.
Does the MACD zero line strategy work on stocks in India?
In this backtest, the MACD zero line strategy on stocks in India produced positive expectancy on Nifty 50, Reliance, HDFC Bank, and Infosys, though the strength of the edge varied by symbol.
What is a MACD zero line crossover strategy?
A MACD zero line crossover strategy uses the move of the MACD line from below zero to above zero as a bullish momentum signal. In practice, it is the same core idea used in this backtest.
Is the MACD zero line strategy profitable?
In this backtest, the MACD zero line strategy had a positive average return per trade and a profit factor above 1. That does not guarantee the same result in live trading or on every stock.
What is the exit rule in the MACD zero line strategy?
The exit rule in this backtest was either a 2 ATR trailing stop or a 20-bar exit, whichever came first.
Can the MACD zero line strategy be used for swing trading?
Yes. The strategy fits swing trading naturally because it waits for momentum to turn positive and then tries to ride the follow-through.
Final take
This is a solid baseline momentum setup, not a magic formula.
The entry rule is simple, the exit behavior makes sense, and the better trades are big enough to matter. One backtest is not enough to justify trading it blindly, but it is enough to keep the strategy in the research pile and compare it against other momentum systems.
For comparison with other simple trend systems, see the 20 EMA pullback strategy backtest and the 20-50 SMA crossover backtest on Nifty 50.
Share this insight
Spread the Alpha
Related Articles
More ideas that align with your trading playbook.

Supertrend Strategy Backtest
Supertrend strategy backtest on Nifty 50, Bank Nifty, Sensex, Maruti Suzuki, Power Grid and Trent, with variant comparison, ticker-wise results and drawdown.
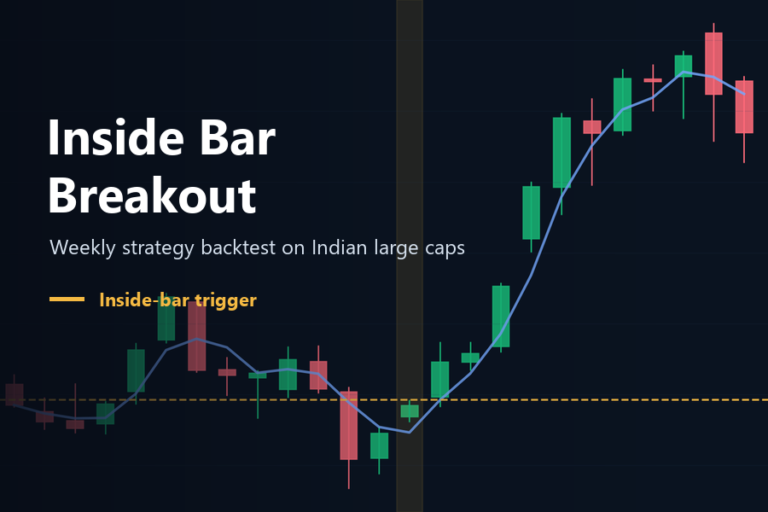
Inside Bar Breakout Strategy Backtest
A weekly inside bar breakout strategy backtest on Nifty 50 and 7 large-cap stocks, with per-ticker win rates, profit factors, drawdowns, and…

EMA 10 20 Crossover Strategy on Indian Large Caps: Where It Worked Best
A daily EMA 10 20 crossover strategy backtest on Nifty 50 and 7 large-cap stocks, with per-ticker win rates, profit factors, drawdowns,…
 DailyBulls (Arthashilpi Ventures) is a D-U-N-S verified company.