
EMA 10 20 Crossover Strategy on Indian Large Caps: Where It Worked Best
The EMA 10 20 crossover strategy is a simple trend-following rule: buy when the 10-day EMA crosses above the 20-day EMA, then exit on the first close back below the 20-day EMA. This EMA 10 20 crossover strategy backtest checks that rule on Nifty 50, TCS, ICICI Bank, L&T, Bharti Airtel, Hindustan Unilever, Asian Paints, and Titan.
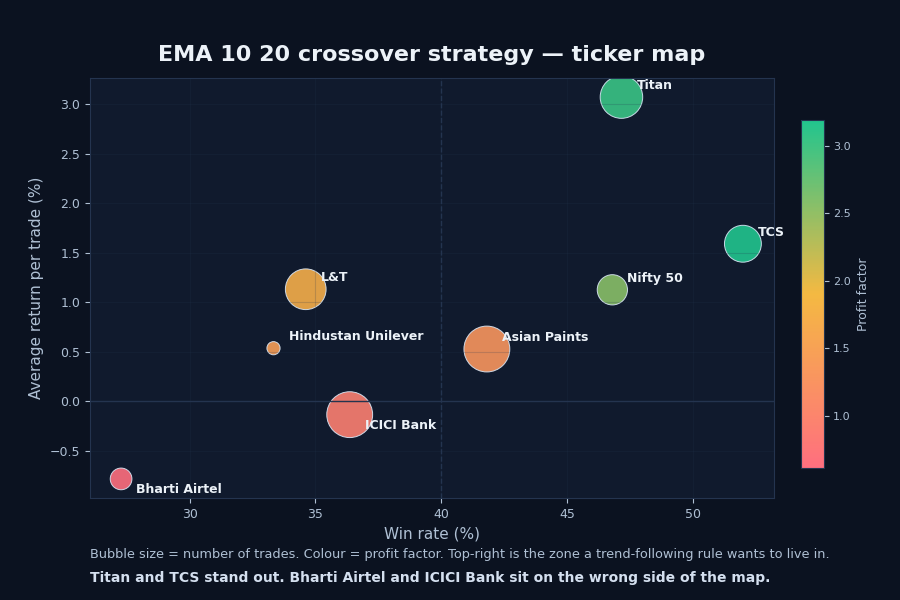
On the fresh 8-name basket, the strategy held up well enough to deserve a full draft. Across all trades, it produced 398 signals, a 40.20% win rate, a 0.91% average return per trade, and a 1.64 profit factor. That combined view is useful as a baseline, but the more important read is still the ticker split. Titan and TCS were strong fits. Bharti Airtel and ICICI Bank were not.
What is the EMA 10 20 crossover strategy?
The EMA 10 20 crossover strategy is a moving-average trend rule. It uses a faster EMA and a slower EMA to identify when short-term momentum starts improving relative to the recent intermediate trend.
The logic is simple:
- the 10-day EMA reacts faster to recent price movement
- the 20-day EMA reacts more slowly
- when the 10-day EMA crosses above the 20-day EMA, momentum has turned more bullish than it was before
- the trade is entered on the next session open and held until price closes back below the 20-day EMA
Many traders describe the same idea as a 10 EMA 20 EMA crossover strategy. The wording changes, but the setup is the same. It is a momentum-following approach, not a bottom-picking one.
That matters because this rule will naturally miss the first part of a move. The entry comes only after some improvement is already visible. In return, it avoids guessing at reversals too early.
This kind of rule usually works best in names that can trend for weeks at a time. It usually works worse in choppy stocks where price keeps crossing back and forth around the moving averages.
Rules used in this backtest
This test used four rules:
- Wait for the 10-day EMA to cross above the 20-day EMA.
- Treat that day as the signal.
- Enter on the next session open.
- Exit on the first close below the 20-day EMA.
That is the full rule set used here. No volume filter. No long-term trend filter. No extra stop-loss layer beyond the EMA-based exit.
EMA 10 20 crossover strategy at a glance
| Item | Detail |
|---|---|
| Setup | 10-day EMA crosses above 20-day EMA |
| Entry | Next session open |
| Exit | First close below 20-day EMA |
| Basket tested | Nifty 50 + 7 large-cap stocks |
| Total trades | 398 |
| Basket win rate | 40.20% |
| Avg return per trade | 0.91% |
| Profit factor | 1.64 |
| Basket max drawdown | -36.13% |
| Avg holding period | 15.31 bars |
That table gives the broad picture. The ticker-by-ticker breakdown is where the setup becomes much easier to judge.
Per-ticker results table
| Ticker | Trades | Wins | Losses | Win rate | Avg return/trade | Profit factor | Total return | Max drawdown |
|---|---|---|---|---|---|---|---|---|
| Titan | 53 | 25 | 28 | 47.17% | 3.07% | 3.04 | 315.41% | -13.59% |
| TCS | 50 | 26 | 24 | 52.00% | 1.59% | 3.19 | 109.46% | -6.67% |
| Nifty 50 | 47 | 22 | 25 | 46.81% | 1.13% | 2.55 | 63.29% | -9.81% |
| L&T | 52 | 18 | 34 | 34.62% | 1.13% | 1.70 | 56.43% | -21.37% |
| Hindustan Unilever | 42 | 14 | 28 | 33.33% | 0.54% | 1.44 | 19.05% | -21.98% |
| Asian Paints | 55 | 23 | 32 | 41.82% | 0.53% | 1.30 | 22.42% | -22.64% |
| ICICI Bank | 55 | 20 | 35 | 36.36% | -0.13% | 0.92 | -12.90% | -32.04% |
| Bharti Airtel | 44 | 12 | 32 | 27.27% | -0.78% | 0.61 | -31.69% | -36.13% |
The split is useful because the same rule behaved very differently across the basket. Some names had enough trend persistence for the EMA crossover to compound. Others kept producing weak follow-through and repeated whipsaws.
Per-ticker diagnostics graphic
The chart below makes that easier to see. Average return per trade and profit factor stayed comfortably positive for Titan, TCS, Nifty 50, and L&T. Bharti Airtel and ICICI Bank dragged the basket down.
Best and worst performers
Best fits for the strategy
Titan was the standout name in this rerun.
- 53 trades
- 47.17% win rate
- 3.07% average return per trade
- 3.04 profit factor
- 315.41% total compounded trade-sequence return
The win rate was not extremely high, but the winners were large enough to more than compensate for the losers.
TCS was the cleanest balance of hit rate and payoff.
- 50 trades
- 52.00% win rate
- 1.59% average return per trade
- 3.19 profit factor
- only -6.67% max drawdown in the trade-sequence view
That is the type of profile trend-following traders usually want from a simple crossover rule.
Nifty 50 also held up well.
- 47 trades
- 46.81% win rate
- 1.13% average return per trade
- 2.55 profit factor
- 63.29% total return
The index result matters because it shows the rule was not limited to one unusually strong stock.
Mixed but still usable names
L&T looked unusual. The win rate was only 34.62%, but the average return per trade still came in above 1%.
That usually means the winning trends were strong enough to carry a lot of small failures. This is a good reminder that crossover systems do not need high win rates to work.
Hindustan Unilever and Asian Paints stayed positive, but neither was especially strong. They looked usable, not exciting.
Weak fits
ICICI Bank ended slightly negative.
- 55 trades
- 36.36% win rate
- -0.13% average return per trade
- 0.92 profit factor
That is a weak outcome for a rule this simple.
Bharti Airtel was the weakest overall fit in this basket.
- 44 trades
- 27.27% win rate
- -0.78% average return per trade
- 0.61 profit factor
- -31.69% total return
- -36.13% max drawdown
That is the kind of result that can damage a blended basket summary if the rule is applied too broadly without ticker selection.
Example trade
The chart below shows an example EMA 10 20 crossover strategy trade, with the crossover signal, entry, holding period, and exit marked on the chart.
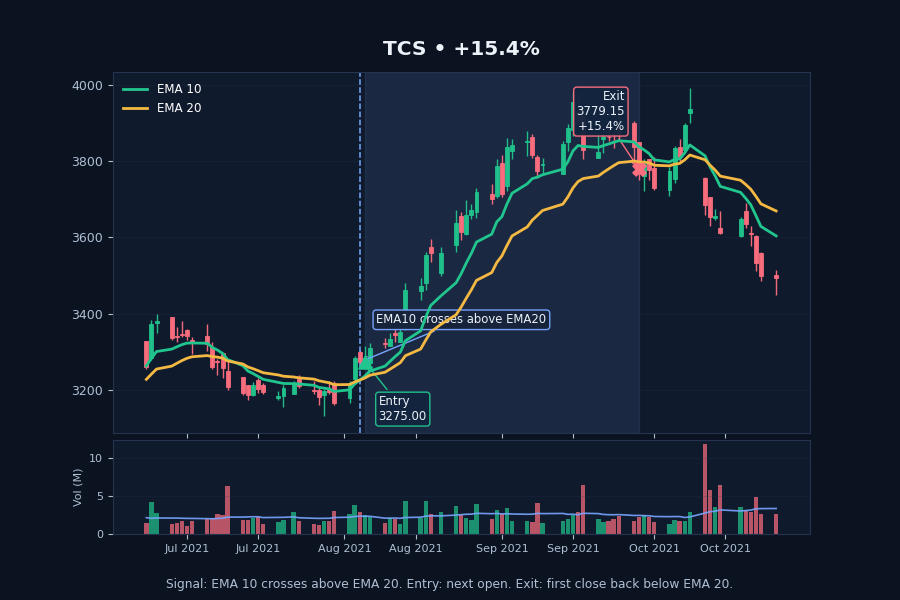
This is the kind of trade the setup needs. The fast EMA crosses above the slow EMA, price follows through for several weeks, and the exit only happens when the trend weakens enough for price to close back below the 20-day EMA.
Where the strategy worked and failed
This EMA crossover strategy worked best when:
- the underlying stock already had trend persistence
- the crossover happened early in a broader move
- price stayed above the 20-day EMA long enough for the winner to develop
It worked poorly when:
- the stock kept chopping around the moving averages
- the crossover came inside a noisy sideways phase
- the next leg higher never developed into a real trend
That is the main trade-off with a moving-average crossover system. It is simple, but simplicity also means it will take a lot of weak signals in the wrong market conditions.
Limits of this backtest
A few limits are worth keeping in view:
- the basket was still only 8 instruments
- no slippage, brokerage, or taxes were included
- the exit rule was fixed to price closing below the 20-day EMA
- this article focuses on long-only daily signals
- trade-sequence return is not the same thing as a live portfolio allocation test
So this is not proof that the EMA 10 20 crossover strategy works on every stock. It is evidence that the rule can be useful on some names and mediocre on others.
FAQ about the EMA 10 20 crossover strategy
What is the EMA 10 20 crossover strategy?
The EMA 10 20 crossover strategy buys when the 10-day EMA crosses above the 20-day EMA and exits when price closes back below the 20-day EMA.
Does the EMA 10 20 crossover strategy work on stocks?
It can, but the result depends heavily on the ticker. This rerun showed strong outcomes on Titan and TCS, while Bharti Airtel and ICICI Bank were weak fits.
Is the EMA 10 20 crossover strategy profitable?
It was profitable on the basket as a whole in this rerun, but the useful conclusion is still ticker-level, not basket-level. Some stocks had strong expectancy while others did not.
Why can a low-win-rate crossover system still work?
Because the winning trades can be much larger than the losing trades. L&T is the clearest example in this rerun: a low hit rate, but enough upside in the winners to keep the strategy positive.
What is the main weakness of the EMA 10 20 crossover strategy?
Its main weakness is whipsaw. When a stock keeps moving sideways, the rule can generate repeated false signals and give back gains quickly.
Final take
This EMA 10 20 crossover strategy backtest produced a much cleaner article candidate than the inside-bar weekly rerun.
The per-ticker split is the key. Titan, TCS, Nifty 50, and L&T showed enough edge to make the strategy worth studying further. Bharti Airtel and ICICI Bank did not. That does not kill the setup. It just means the rule should be judged with ticker selection in mind instead of being treated as universally reliable.
.
Share this insight
Spread the Alpha
Related Articles
More ideas that align with your trading playbook.

Supertrend Strategy Backtest
Supertrend strategy backtest on Nifty 50, Bank Nifty, Sensex, Maruti Suzuki, Power Grid and Trent, with variant comparison, ticker-wise results and drawdown.
Inside Bar Breakout Strategy Backtest
A weekly inside bar breakout strategy backtest on Nifty 50 and 7 large-cap stocks, with per-ticker win rates, profit factors, drawdowns, and…
MACD Zero Line Strategy Backtest on Nifty 50 Stocks
A backtest of the MACD zero line strategy on Nifty 50, Reliance, HDFC Bank, and Infosys with chart examples, exit analysis, and…
 DailyBulls (Arthashilpi Ventures) is a D-U-N-S verified company.