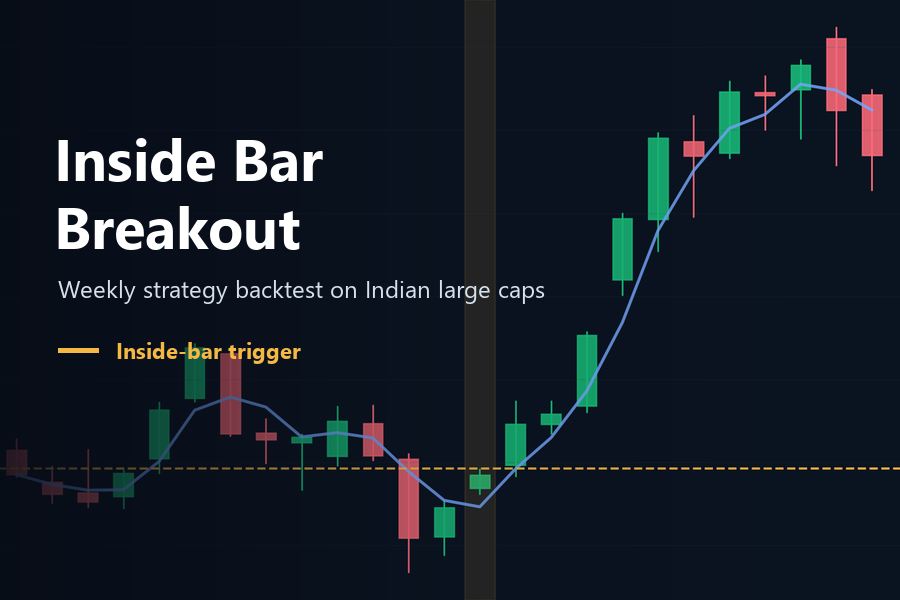
Inside Bar Breakout Strategy Backtest
The inside bar breakout strategy is a simple price-action idea: wait for a narrow inside bar, then buy if price closes above the prior high. This inside bar breakout strategy backtest checks that rule on weekly data for Nifty 50, TCS, ICICI Bank, L&T, SBI, ITC, Bharti Airtel, and Sun Pharma.
Across the full basket, the weekly inside bar breakout strategy produced 147 trades, a 52.38% win rate, a 0.30% average return per trade, and a 1.13 profit factor. Those headline numbers look acceptable at first glance, but they hide the more important point: the strategy held up well in a few names and broke down badly in others. That is why the ticker-by-ticker split matters more than the combined basket number.
What is the inside bar breakout strategy?
The inside bar breakout strategy is built around a simple price pattern. An inside bar forms when one candle stays completely inside the range of the previous candle. On a weekly chart, that usually means one week of pause or compression after a larger move.
The basic idea is straightforward:
- the market pauses for one week
- that pause creates an inside bar
- if the next close pushes above the prior high, the pause may be ending in the direction of a breakout
- the trade is then managed with a fixed exit rule
Because this version uses weekly candles instead of daily candles, it is best thought of as a weekly inside bar breakout strategy.
The attraction is obvious. It is clean price action. No complicated indicator stack. No subjective trendline work. Just a compression pattern and a breakout trigger.
The trade-off is also obvious. Inside bars appear in both strong and weak names. If the surrounding trend is clean, the breakout can work nicely. If the stock is noisy or mean-reverting, the same pattern can fail quickly.
Rules used in this backtest
This test used four rules:
- Last week had to be an inside bar.
- This week had to close above the prior week’s high.
- Entry happened on the next week’s open.
- Exit happened after 4 bars.
That is the full rule set. No moving-average filter. No volume confirmation. No trend-strength overlay. No extra stop-loss layer.
Inside bar breakout strategy at a glance
| Item | Detail |
|---|---|
| Pattern | Weekly inside bar breakout |
| Entry trigger | Close above prior week’s high |
| Entry timing | Next week’s open |
| Exit | Fixed 4-bar hold |
| Basket tested | Nifty 50 + 7 large-cap stocks |
Results from weekly inside bar breakout strategy
| Metric | Result |
|---|---|
| Total trades | 147 |
| Basket win rate | 52.38% |
| Avg return per trade | 0.30% |
| Median return per trade | 0.44% |
| Profit factor | 1.13 |
| Basket max drawdown | -71.05% |
| Best trade | 13.44% |
| Worst trade | -31.50% |
That table shows the combined result across the full basket. The more useful read still comes from the ticker-by-ticker split.
Ticker-wise backtest results
| Ticker | Trades | Wins | Losses | Win rate | Avg return/trade | Profit factor | Total return | Max drawdown |
|---|---|---|---|---|---|---|---|---|
| Nifty 50 | 17 | 10 | 7 | 58.82% | 1.69% | 2.86 | 31.25% | -5.48% |
| Bharti Airtel | 20 | 12 | 8 | 60.00% | 1.62% | 1.93 | 33.38% | -9.79% |
| TCS | 19 | 11 | 8 | 57.89% | 0.67% | 1.52 | 12.31% | -5.92% |
| L&T | 25 | 14 | 11 | 56.00% | 0.89% | 1.41 | 18.81% | -13.73% |
| ICICI Bank | 15 | 7 | 8 | 46.67% | 0.54% | 1.27 | 6.44% | -19.19% |
| ITC | 14 | 4 | 10 | 28.57% | 0.34% | 1.15 | 2.09% | -16.57% |
| SBI | 19 | 10 | 9 | 52.63% | -0.10% | 0.96 | -5.33% | -36.38% |
| Sun Pharma | 18 | 9 | 9 | 50.00% | -3.48% | 0.40 | -53.24% | -63.90% |
The first thing to notice is that the strategy was not uniformly good. Nifty 50 and Bharti Airtel were clearly the strongest fits. TCS and L&T were also usable. ICICI Bank was positive but less convincing. SBI and Sun Pharma were poor fits for this exact rule.
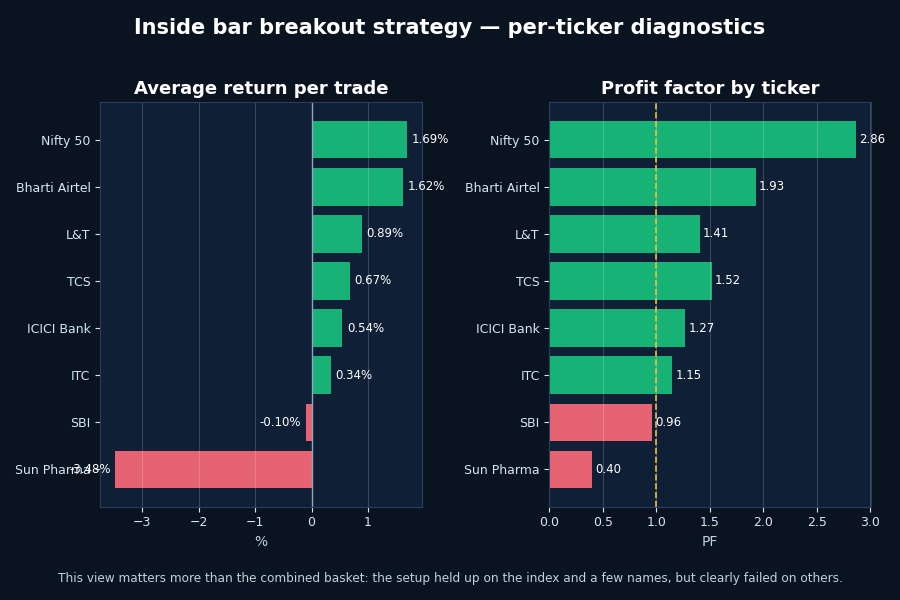
Per-ticker diagnostics graphic
The chart below makes the split easier to read. Average return per trade and profit factor stayed comfortably positive for Nifty 50, Bharti Airtel, TCS, and L&T, while Sun Pharma dragged the basket badly.
Best and worst performers
Best fits for the strategy
Nifty 50 was the cleanest overall profile.
- 17 trades
- 58.82% win rate
- 1.69% average return per trade
- 2.86 profit factor
- only -5.48% max drawdown
That is the sort of profile traders usually want from a simple pattern rule: decent hit rate, strong payoff, and manageable drawdown.
Bharti Airtel was the second clear winner.
- 20 trades
- 60.00% win rate
- 1.62% average return per trade
- 1.93 profit factor
- 33.38% total return across the trades in this sample
That combination is strong enough to take seriously.
Borderline but still usable
TCS and L&T were not spectacular, but they were still constructive.
- TCS had a 57.89% win rate and a 1.52 profit factor.
- L&T had more trades, a 56.00% win rate, and a 1.41 profit factor.
That is not enough to call the strategy universally strong, but it is enough to say the setup had some edge in trend-friendlier names.
Weak fits
SBI looked weak because the expectancy turned negative even though the win rate stayed above 50%.
That usually means the losing trades were simply larger than the winners.
Sun Pharma was the clearest failure in this basket.
- 18 trades
- 9 wins and 9 losses
- -3.48% average return per trade
- 0.40 profit factor
- -53.24% total return
- -63.90% max drawdown
- worst trade: -31.50%
That one ticker alone is enough to show why per-ticker reporting matters.
Example trade
The chart below shows an example weekly inside bar breakout trade, with the inside-bar week, breakout level, entry, and 4-week exit marked on the chart.
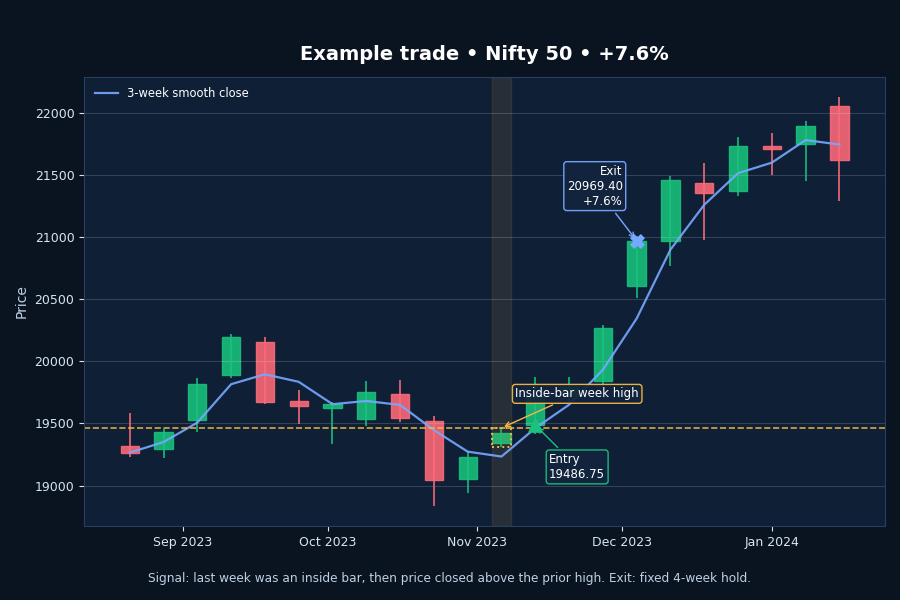
This kind of trade explains why the setup can work. Price compresses for a week, closes above the prior high, then keeps moving for the next few weeks without immediately falling back into the old range.
Where the strategy worked and where it failed
This weekly inside bar breakout strategy looked better when:
- the underlying ticker already had a clean trend
- weekly ranges were orderly rather than erratic
- post-breakout follow-through happened quickly
It looked worse when:
- the stock had frequent whipsaws
- breakout candles did not attract follow-through
- losing trades were much larger than the average winner
That last point matters a lot. A ticker can still post a reasonable win rate and lose money overall if the payoff profile is poor. SBI is a clear example.
Limits of this backtest
A few limits matter here:
- the basket was still small at 8 instruments
- no slippage, brokerage, or taxes were included
- the exit rule was a fixed 4-bar hold, not an optimized trend exit
- this article focuses on long-only weekly signals
- one pattern can behave very differently across sectors and stock personalities
So this is not the kind of result that supports using the inside bar breakout strategy on every stock. It looked useful on some names and poor on others.
FAQ about the inside bar breakout strategy
What is the inside bar breakout strategy?
The inside bar breakout strategy buys after an inside bar forms and price then closes above the prior high.
Does the inside bar breakout strategy work on stocks?
It can, but this backtest shows that results vary a lot by ticker. It worked much better on Nifty 50 and Bharti Airtel than on Sun Pharma or SBI.
Is the weekly inside bar breakout strategy profitable?
It was profitable on some names in this basket, but not on all of them. That is why per-ticker diagnostics matter more than one combined headline number.
What is the win rate of the inside bar breakout strategy in this backtest?
The combined basket win rate was 52.38%, but the better question is the ticker-level win rate. It ranged from 28.57% on ITC to 60.00% on Bharti Airtel.
Why did Sun Pharma perform so poorly?
The backtest result suggests that the weekly inside bar breakout pattern did not translate into clean follow-through on Sun Pharma. The losing trades were simply too damaging for the strategy to recover.
Final take
This inside bar breakout strategy backtest produced a useful result, even though it was not a uniformly strong one.
The main lesson is simple: this is not a pattern that should be treated as automatically reliable across every stock. On Nifty 50, Bharti Airtel, TCS, and L&T, the strategy had enough edge to be interesting. On Sun Pharma and SBI, it did not.
That is exactly why the per-ticker view is the right way to read this setup. One blended basket number can hide a lot of weakness. The ticker-level breakdown shows where the strategy deserves more attention and where it probably does not.
Share this insight
Spread the Alpha
Related Articles
More ideas that align with your trading playbook.

Supertrend Strategy Backtest
Supertrend strategy backtest on Nifty 50, Bank Nifty, Sensex, Maruti Suzuki, Power Grid and Trent, with variant comparison, ticker-wise results and drawdown.

EMA 10 20 Crossover Strategy on Indian Large Caps: Where It Worked Best
A daily EMA 10 20 crossover strategy backtest on Nifty 50 and 7 large-cap stocks, with per-ticker win rates, profit factors, drawdowns,…
MACD Zero Line Strategy Backtest on Nifty 50 Stocks
A backtest of the MACD zero line strategy on Nifty 50, Reliance, HDFC Bank, and Infosys with chart examples, exit analysis, and…
 DailyBulls (Arthashilpi Ventures) is a D-U-N-S verified company.